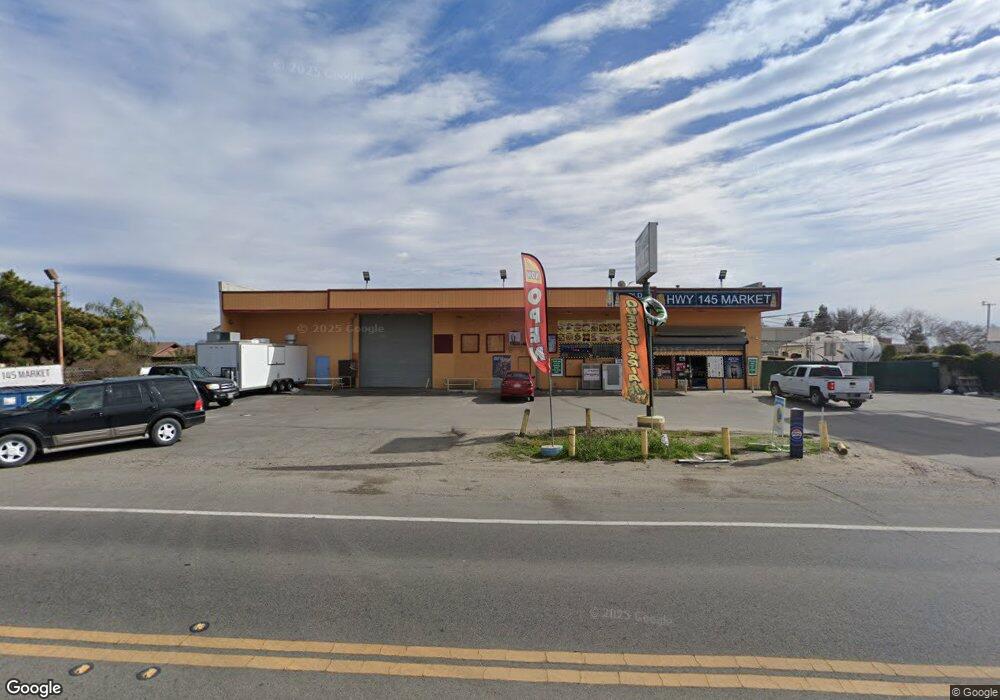
1048 N Madera Ave Kerman, CA 93630
Estimated Value: $473,676
Studio
--
Bath
5,500
Sq Ft
$86/Sq Ft
Est. Value
About This Home
This home is located at 1048 N Madera Ave, Kerman, CA 93630 and is currently estimated at $473,676, approximately $86 per square foot. 1048 N Madera Ave is a home located in Fresno County with nearby schools including Sun Empire Elementary School.
Ownership History
Date
Name
Owned For
Owner Type
Purchase Details
Closed on
Apr 30, 2020
Sold by
Albadahi Adel K and Rashed Yahya A
Bought by
Rashed Yahya A and Abobaker Ibtisam
Current Estimated Value
Purchase Details
Closed on
Nov 30, 2016
Sold by
Abdulla Nabila Taher Saleh
Bought by
Albadahi Adel K
Home Financials for this Owner
Home Financials are based on the most recent Mortgage that was taken out on this home.
Original Mortgage
$100,000
Outstanding Balance
$82,315
Interest Rate
4.08%
Mortgage Type
Stand Alone Second
Estimated Equity
$391,361
Purchase Details
Closed on
Nov 21, 2016
Sold by
Ramirez Richard C and Ramirez Martha M
Bought by
Albadahi Adel K and Rashed Yahya A
Home Financials for this Owner
Home Financials are based on the most recent Mortgage that was taken out on this home.
Original Mortgage
$100,000
Outstanding Balance
$82,315
Interest Rate
4.08%
Mortgage Type
Stand Alone Second
Estimated Equity
$391,361
Purchase Details
Closed on
Sep 17, 1996
Sold by
Ramirez Richard C and Ramirez Martha M
Bought by
State Of California
Create a Home Valuation Report for This Property
The Home Valuation Report is an in-depth analysis detailing your home's value as well as a comparison with similar homes in the area
Purchase History
| Date | Buyer | Sale Price | Title Company |
|---|---|---|---|
| Rashed Yahya A | -- | None Available | |
| Albadahi Adel K | -- | Chicago Title Company | |
| Albadahi Adel K | $265,000 | Chicago Title Company | |
| State Of California | -- | -- |
Source: Public Records
Mortgage History
| Date | Status | Borrower | Loan Amount |
|---|---|---|---|
| Open | Albadahi Adel K | $100,000 | |
| Previous Owner | Albadahi Adel K | $100,000 | |
| Previous Owner | Albadahi Adel K | $100,000 |
Source: Public Records
Tax History
| Year | Tax Paid | Tax Assessment Tax Assessment Total Assessment is a certain percentage of the fair market value that is determined by local assessors to be the total taxable value of land and additions on the property. | Land | Improvement |
|---|---|---|---|---|
| 2025 | $3,919 | $338,648 | $54,847 | $283,801 |
| 2023 | $3,787 | $308,775 | $52,718 | $256,057 |
| 2022 | $3,532 | $302,722 | $51,685 | $251,037 |
| 2021 | $3,435 | $296,787 | $50,672 | $246,115 |
| 2020 | $3,255 | $281,219 | $42,448 | $238,771 |
| 2019 | $3,540 | $301,776 | $41,616 | $260,160 |
| 2018 | $3,389 | $296,370 | $40,800 | $255,570 |
| 2017 | $2,375 | $204,977 | $35,775 | $169,202 |
| 2016 | $2,162 | $201,470 | $35,074 | $166,396 |
| 2015 | $2,122 | $196,467 | $34,548 | $161,919 |
| 2014 | $2,108 | $195,784 | $33,872 | $161,912 |
Source: Public Records
Map
Nearby Homes
- 220 S Madera Ave Unit 23
- 220 S Madera Ave Unit 10
- 220 S Madera Ave Unit SPC 9
- 220 S Madera Ave Unit 95
- 15783 Crimson Ave
- 15627 W Botelho Ave
- 104 N Koleen Ave
- 14206 W Gragnani
- 15717 W Botelho Ave
- 14853 W Middleton Ave
- 15647 Wooten Ct
- 524 S 6th St
- 14531 W Kearney Blvd
- 16172 W David Ave
- 16180 W David Ave
- 16190 W David Ave
- 16210 W David Ave
- 16220 W David Ave
- 505 S Del Norte Ave
- 443 S Park Ave
- 1074 N Madera Ave
- 1110 N Madera Ave
- 1128 N Madera Ave
- 1156 N Madera Ave
- 1178 N Madera Ave
- 1210 N Madera Ave
- 1395 N Madera Ave
- 733 N Madera Ave
- 15287 W Belmont Ave Unit A
- 15360 W Belmont Ave
- 661 N Madera Ave
- 564 N Madera Ave
- 697 N Vineland Ave
- 1600 N Madera Ave
- 663 N Vineland Ave
- 867 N Del Norte Ave
- 1649 N Madera Ave
- 14494 W Olive Ave
- 402 N Madera Ave
- 636 N Vineland Ave
Your Personal Tour Guide
Ask me questions while you tour the home.