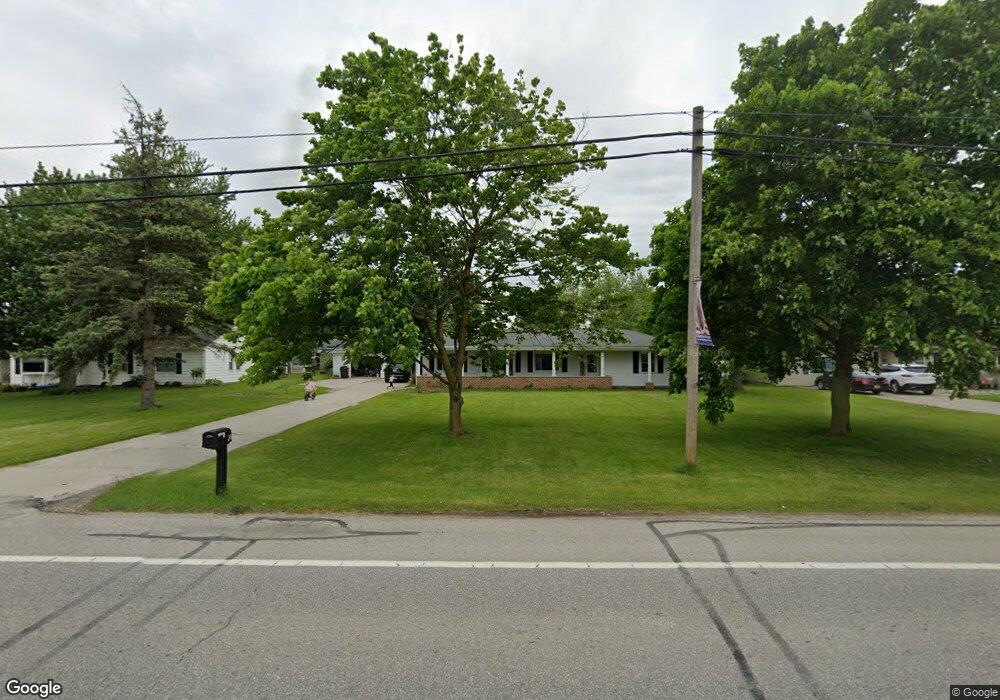
1048 N Williams St Paulding, OH 45879
Estimated Value: $172,000 - $240,000
3
Beds
2
Baths
1,610
Sq Ft
$124/Sq Ft
Est. Value
About This Home
This home is located at 1048 N Williams St, Paulding, OH 45879 and is currently estimated at $199,815, approximately $124 per square foot. 1048 N Williams St is a home located in Paulding County with nearby schools including Paulding High School.
Ownership History
Date
Name
Owned For
Owner Type
Purchase Details
Closed on
Apr 17, 2020
Sold by
Breedlove Chad C and Breedlove Theresa E
Bought by
Owens Bryin R and Evans Kierra M
Current Estimated Value
Home Financials for this Owner
Home Financials are based on the most recent Mortgage that was taken out on this home.
Original Mortgage
$93,279
Interest Rate
3.2%
Mortgage Type
FHA
Purchase Details
Closed on
Sep 10, 2007
Sold by
Vogel Beverly J
Bought by
Breedlove Chad C and Breedlove Theresa E
Home Financials for this Owner
Home Financials are based on the most recent Mortgage that was taken out on this home.
Original Mortgage
$103,424
Interest Rate
6.66%
Mortgage Type
VA
Purchase Details
Closed on
Dec 29, 1998
Bought by
Breedlove Chad C Breedlove Theresa
Create a Home Valuation Report for This Property
The Home Valuation Report is an in-depth analysis detailing your home's value as well as a comparison with similar homes in the area
Home Values in the Area
Average Home Value in this Area
Purchase History
We collect this data history from publicly available records. To have your information removed, we recommend requesting removal directly through your county’s website.
| Date | Buyer | Sale Price | Title Company |
|---|---|---|---|
| Owens Bryin R | $95,000 | None Available | |
| Breedlove Chad C | $101,000 | None Available | |
| Breedlove Chad C Breedlove Theresa | -- | -- |
Source: Public Records
Mortgage History
We collect this data history from publicly available records. To have your information removed, we recommend requesting removal directly through your county’s website.
| Date | Status | Borrower | Loan Amount |
|---|---|---|---|
| Previous Owner | Owens Bryin R | $93,279 | |
| Previous Owner | Breedlove Chad C | $103,424 |
Source: Public Records
Tax History
| Year | Tax Paid | Tax Assessment Tax Assessment Total Assessment is a certain percentage of the fair market value that is determined by local assessors to be the total taxable value of land and additions on the property. | Land | Improvement |
|---|---|---|---|---|
| 2025 | $2,533 | $58,530 | $15,020 | $43,510 |
| 2024 | $2,533 | $45,010 | $11,550 | $33,460 |
| 2023 | $2,024 | $45,010 | $11,550 | $33,460 |
| 2022 | $1,976 | $45,010 | $11,550 | $33,460 |
| 2021 | $1,716 | $34,970 | $8,680 | $26,290 |
| 2020 | $1,580 | $34,970 | $8,680 | $26,290 |
| 2019 | $1,593 | $32,590 | $8,680 | $23,910 |
| 2018 | $1,508 | $32,590 | $8,680 | $23,910 |
| 2017 | $1,509 | $32,590 | $8,680 | $23,910 |
| 2016 | $1,514 | $32,590 | $8,680 | $23,910 |
| 2015 | $1,465 | $31,990 | $8,680 | $23,310 |
| 2014 | $1,459 | $31,990 | $8,680 | $23,310 |
| 2013 | $1,574 | $31,990 | $8,680 | $23,310 |
Source: Public Records
Map
Nearby Homes
- 12035 Royer Ave
- 830 N Walnut St
- 809 Country View Dr
- 745 Woodring Ave
- 1157 Emerald Rd
- 713 N Walnut St
- 516 N Williams St
- 13502 Rita St
- 13795 Nancy St
- 301 N Main St
- 215 N Dewitt St
- 780 W Jackson St
- 420 W Harrison St
- 111 W Wayne St
- 714 W Wayne St
- 335 S Williams St
- 742 E Perry St
- 11051 Road 93
- 9266 Road 107
- 9881 Road 180
- 1036 N Williams St
- 1070 N Williams St
- 1052 N Williams St
- 12464 Maple Ave
- 12582 Maple Ave
- 12438 Maple Ave
- 1028 N Williams St
- 12532 Maple Ave
- 12388 Maple Ave
- 1071 N Williams St
- 12642 Maple Ave
- 1020 N Williams St
- 1082 N Williams St
- 12487 Maple Ave
- 12702 Maple Ave
- 12415 Maple Ave
- 1019 N Williams St
- 12320 Maple Ave
- 1090 N Williams St
- 12547 Maple Ave
Your Personal Tour Guide
Ask me questions while you tour the home.