Estimated Value: $360,000 - $378,000
3
Beds
3
Baths
1,514
Sq Ft
$244/Sq Ft
Est. Value
About This Home
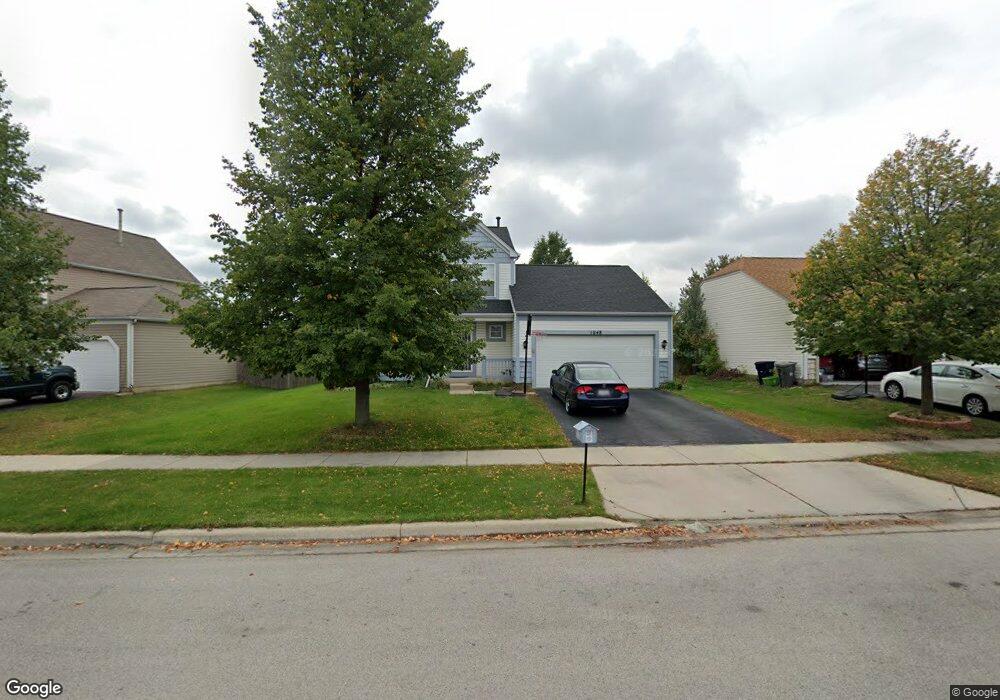
This home is located at 1048 Willow Bay, Elgin, IL 60123 and is currently estimated at $369,128, approximately $243 per square foot. 1048 Willow Bay is a home located in Kane County with nearby schools including Fox Meadow Elementary School, Kenyon Woods Middle School, and South Elgin High School.
Ownership History
Date
Name
Owned For
Owner Type
Purchase Details
Closed on
Sep 30, 2002
Sold by
Castillo Jose L and Tristani Mary A
Bought by
Obispo Romeo S and Obispo Lea M
Current Estimated Value
Home Financials for this Owner
Home Financials are based on the most recent Mortgage that was taken out on this home.
Original Mortgage
$193,350
Outstanding Balance
$81,534
Interest Rate
6.24%
Mortgage Type
FHA
Estimated Equity
$287,594
Purchase Details
Closed on
Sep 15, 2000
Sold by
West Suburban Bank
Bought by
Castillo Jose L and Tristani Mary A
Home Financials for this Owner
Home Financials are based on the most recent Mortgage that was taken out on this home.
Original Mortgage
$135,600
Interest Rate
7.96%
Purchase Details
Closed on
Oct 2, 1997
Sold by
Pulte Home Corp
Bought by
West Suburban Bank and Trust #10641
Home Financials for this Owner
Home Financials are based on the most recent Mortgage that was taken out on this home.
Original Mortgage
$35,000
Interest Rate
6.25%
Create a Home Valuation Report for This Property
The Home Valuation Report is an in-depth analysis detailing your home's value as well as a comparison with similar homes in the area
Home Values in the Area
Average Home Value in this Area
Purchase History
| Date | Buyer | Sale Price | Title Company |
|---|---|---|---|
| Obispo Romeo S | $198,000 | -- | |
| Castillo Jose L | $169,500 | -- | |
| West Suburban Bank | $94,666 | First American Title |
Source: Public Records
Mortgage History
| Date | Status | Borrower | Loan Amount |
|---|---|---|---|
| Open | Obispo Romeo S | $193,350 | |
| Previous Owner | Castillo Jose L | $135,600 | |
| Previous Owner | West Suburban Bank | $35,000 |
Source: Public Records
Tax History
| Year | Tax Paid | Tax Assessment Tax Assessment Total Assessment is a certain percentage of the fair market value that is determined by local assessors to be the total taxable value of land and additions on the property. | Land | Improvement |
|---|---|---|---|---|
| 2024 | $6,984 | $103,823 | $28,317 | $75,506 |
| 2023 | $6,589 | $93,796 | $25,582 | $68,214 |
| 2022 | $6,423 | $85,525 | $23,326 | $62,199 |
| 2021 | $6,114 | $79,533 | $21,808 | $57,725 |
| 2020 | $5,921 | $75,926 | $20,819 | $55,107 |
| 2019 | $5,727 | $72,324 | $19,831 | $52,493 |
| 2018 | $5,649 | $68,134 | $18,682 | $49,452 |
| 2017 | $5,494 | $64,411 | $17,661 | $46,750 |
| 2016 | $5,200 | $59,756 | $16,385 | $43,371 |
| 2015 | -- | $54,771 | $15,018 | $39,753 |
| 2014 | -- | $52,561 | $14,833 | $37,728 |
| 2013 | -- | $53,947 | $15,224 | $38,723 |
Source: Public Records
Map
Nearby Homes
- 1141 Delta Ct Unit 255E
- 1094 Delta Dr Unit 41A
- 1202 Delta Dr Unit 115B
- 2350 Camden Bay Unit 176A
- 404 Lowell Dr Unit 3
- 522 Lowell Dr Unit 2
- 1512 Birch Ln
- 1784 College Green Dr
- 1780 College Green Dr Unit 7
- 1264 Sandhurst Ln Unit 3
- 2092 Muirfield Cir
- 2060 Muirfield Cir
- 1247 Sandhurst Ln Unit 4
- 1782 Pebble Beach Cir
- 1604 Pebble Beach Cir
- 76 Ione Dr Unit D
- 766 Michigan Ave
- 920 Gerald Ave Unit 6
- 1506 Kinwood Rd
- 203 Bexley St
- 1044 Willow Bay Unit 1
- 1052 Willow Bay
- 2250 Annandale Ct
- 1056 Willow Bay
- 1040 Willow Bay
- 2255 Annandale Ct
- 2254 Annandale Ct
- 1045 Willow Bay
- 1036 Willow Bay
- 1060 Willow Bay Unit 1
- 1049 Willow Bay
- 2210 Keels Ct
- 2259 Annandale Ct
- 1070 Willow Bay
- 1039 Willow Bay
- 1032 Willow Bay
- 2260 Annandale Ct
- 1491 Champagne Ln
- 2206 Keels Ct
- 1074 Willow Bay Unit 1
Your Personal Tour Guide
Ask me questions while you tour the home.