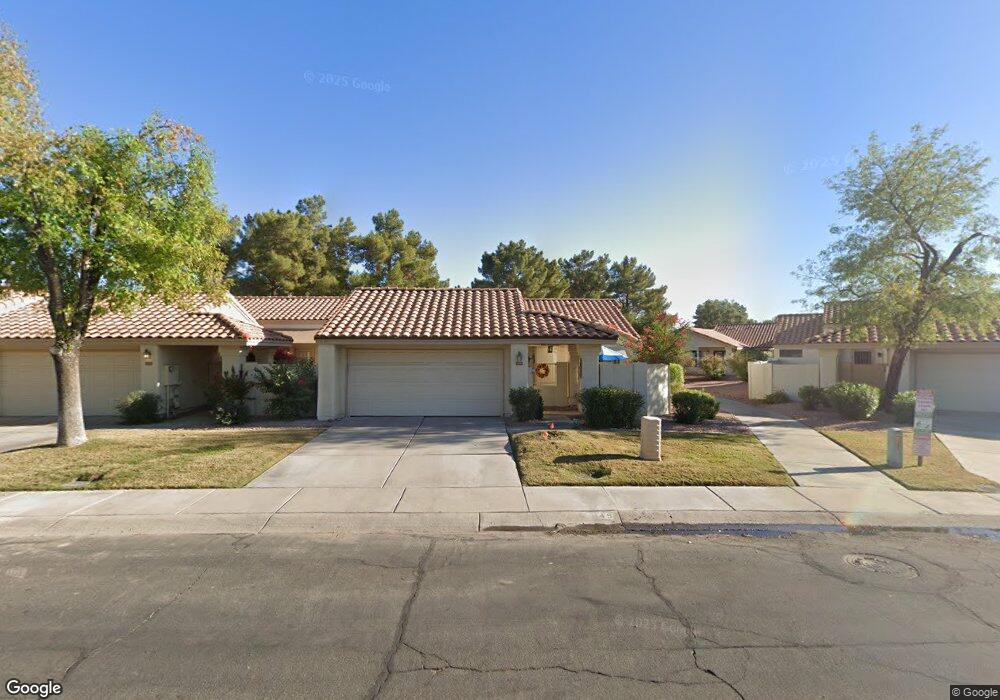
1049 E Chilton Dr Unit <DEN> Tempe, AZ 85283
South Tempe NeighborhoodEstimated Value: $407,000 - $434,000
2
Beds
2
Baths
1,302
Sq Ft
$323/Sq Ft
Est. Value
About This Home
This home is located at 1049 E Chilton Dr Unit
Ownership History
Date
Name
Owned For
Owner Type
Purchase Details
Closed on
Dec 18, 2023
Sold by
Moore Investment Trust and Laird Sandra Elaine
Bought by
Jordan Margaret C
Current Estimated Value
Home Financials for this Owner
Home Financials are based on the most recent Mortgage that was taken out on this home.
Original Mortgage
$131,000
Outstanding Balance
$128,800
Interest Rate
7.44%
Mortgage Type
New Conventional
Estimated Equity
$291,229
Purchase Details
Closed on
Feb 27, 2013
Sold by
Moore Vivian June and Moore Vivian J
Bought by
Laird Sandra Elaine and Park Georgeann
Purchase Details
Closed on
May 10, 2011
Sold by
Wells Fargo Bank Na
Bought by
Moore Vivian June
Purchase Details
Closed on
Jan 4, 2011
Sold by
Abbate Sandra J
Bought by
Wells Fargo Bank Na
Purchase Details
Closed on
Mar 9, 2003
Sold by
Abbate Carmella S
Bought by
Abbate Sandra J
Create a Home Valuation Report for This Property
The Home Valuation Report is an in-depth analysis detailing your home's value as well as a comparison with similar homes in the area
Home Values in the Area
Average Home Value in this Area
Purchase History
| Date | Buyer | Sale Price | Title Company |
|---|---|---|---|
| Jordan Margaret C | $408,000 | Capital Title | |
| Laird Sandra Elaine | -- | None Available | |
| Moore Vivian June | $161,649 | First American Title Ins Co | |
| Wells Fargo Bank Na | $127,761 | None Available | |
| Abbate Sandra J | -- | -- |
Source: Public Records
Mortgage History
| Date | Status | Borrower | Loan Amount |
|---|---|---|---|
| Open | Jordan Margaret C | $131,000 |
Source: Public Records
Tax History
| Year | Tax Paid | Tax Assessment Tax Assessment Total Assessment is a certain percentage of the fair market value that is determined by local assessors to be the total taxable value of land and additions on the property. | Land | Improvement |
|---|---|---|---|---|
| 2025 | $2,274 | $24,338 | -- | -- |
| 2024 | $2,144 | $23,179 | -- | -- |
| 2023 | $2,144 | $32,560 | $6,510 | $26,050 |
| 2022 | $2,033 | $25,920 | $5,180 | $20,740 |
| 2021 | $2,112 | $24,730 | $4,940 | $19,790 |
| 2020 | $2,062 | $22,880 | $4,570 | $18,310 |
| 2019 | $1,997 | $21,960 | $4,390 | $17,570 |
| 2018 | $1,930 | $20,280 | $4,050 | $16,230 |
| 2017 | $1,850 | $19,380 | $3,870 | $15,510 |
| 2016 | $1,876 | $18,720 | $3,740 | $14,980 |
| 2015 | $1,733 | $17,660 | $3,530 | $14,130 |
Source: Public Records
Map
Nearby Homes
- 920 E Mcnair Dr
- 987 E Divot Dr
- 1070 E Sunburst Ln
- 7716 S Rita Ln Unit 3
- 1045 E Sunburst Ln
- 1060 E Louis Way Unit 14
- 831 E Divot Dr
- 1231 E Sunburst Ln
- 1315 E Mcnair Dr
- 758 E Sunburst Ln
- 6833 S Jentilly Ln
- 1011 E Redfield Rd
- 6801 S Palm Dr
- 1032 E Redfield Rd
- 1033 E Bendix Dr
- 1338 E Sunburst Ln
- 1125 E Lodge Dr
- 563 E Krista Way
- 6743 S Newberry Rd
- 6736 S Stanley Place
- 1049 E Chilton Dr
- 1055 E Chilton Dr
- 1043 E Chilton Dr
- 1035 E Chilton Dr
- 1067 E Chilton Dr
- 1027 E Chilton Dr
- 1040 E Mcnair Dr
- 1036 E Mcnair Dr
- 1048 E Chilton Dr
- 1054 E Chilton Dr
- 1073 E Chilton Dr
- 7366 S Bonarden Ln
- 1028 E Mcnair Dr
- 7370 S Bonarden Ln
- 1060 E Chilton Dr
- 1019 E Chilton Dr
- 7374 S Bonarden Ln
- 1020 E Mcnair Dr
- 7378 S Bonarden Ln
- 1011 E Chilton Dr
Your Personal Tour Guide
Ask me questions while you tour the home.