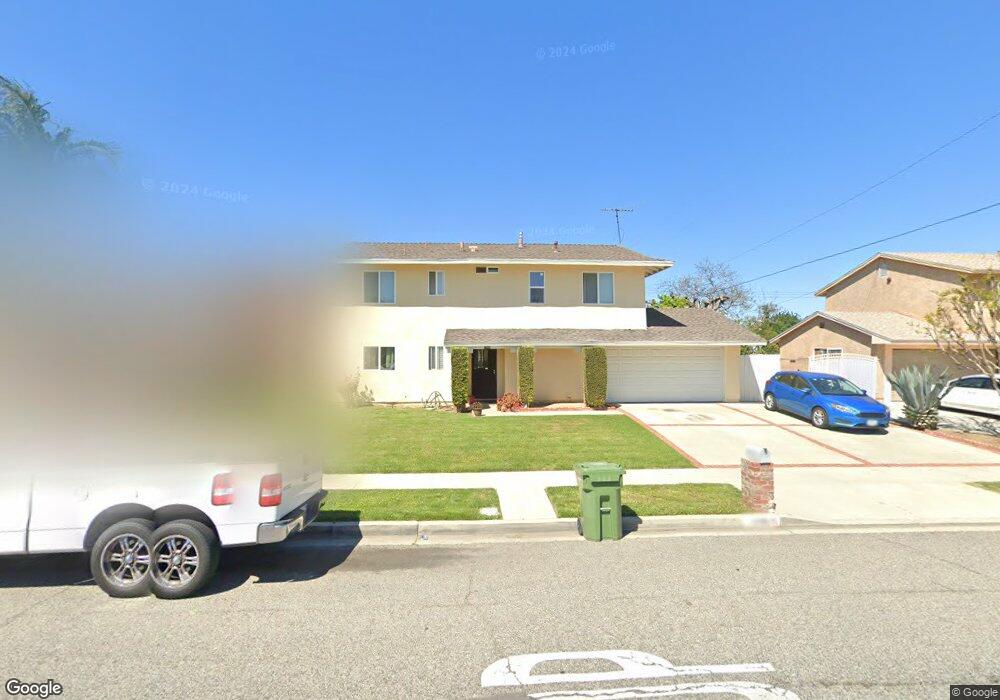
1049 Sycamore Dr Simi Valley, CA 93065
Central Simi Valley NeighborhoodEstimated Value: $792,893 - $853,000
4
Beds
3
Baths
1,725
Sq Ft
$484/Sq Ft
Est. Value
About This Home
This home is located at 1049 Sycamore Dr, Simi Valley, CA 93065 and is currently estimated at $834,223, approximately $483 per square foot. 1049 Sycamore Dr is a home located in Ventura County with nearby schools including Crestview Elementary School, Hillside Middle School, and Royal High School.
Ownership History
Date
Name
Owned For
Owner Type
Purchase Details
Closed on
Mar 5, 2003
Sold by
Mazza Gregory M and Mazza Sandra L
Bought by
Mazza Gregory M and Mazza Sandra L
Current Estimated Value
Home Financials for this Owner
Home Financials are based on the most recent Mortgage that was taken out on this home.
Original Mortgage
$185,000
Interest Rate
5.22%
Mortgage Type
Purchase Money Mortgage
Create a Home Valuation Report for This Property
The Home Valuation Report is an in-depth analysis detailing your home's value as well as a comparison with similar homes in the area
Home Values in the Area
Average Home Value in this Area
Purchase History
| Date | Buyer | Sale Price | Title Company |
|---|---|---|---|
| Mazza Gregory M | -- | Gateway Title Company | |
| Mazza Gregory M | -- | Gateway Title Company |
Source: Public Records
Mortgage History
| Date | Status | Borrower | Loan Amount |
|---|---|---|---|
| Closed | Mazza Gregory M | $185,000 |
Source: Public Records
Tax History Compared to Growth
Tax History
| Year | Tax Paid | Tax Assessment Tax Assessment Total Assessment is a certain percentage of the fair market value that is determined by local assessors to be the total taxable value of land and additions on the property. | Land | Improvement |
|---|---|---|---|---|
| 2025 | $2,860 | $193,745 | $76,538 | $117,207 |
| 2024 | $2,860 | $189,947 | $75,038 | $114,909 |
| 2023 | $2,687 | $186,223 | $73,567 | $112,656 |
| 2022 | $2,650 | $182,572 | $72,124 | $110,448 |
| 2021 | $2,606 | $178,993 | $70,710 | $108,283 |
| 2020 | $2,536 | $177,160 | $69,986 | $107,174 |
| 2019 | $2,418 | $173,687 | $68,614 | $105,073 |
| 2018 | $2,381 | $170,282 | $67,269 | $103,013 |
| 2017 | $2,317 | $166,944 | $65,950 | $100,994 |
| 2016 | $2,208 | $163,671 | $64,657 | $99,014 |
| 2015 | $2,149 | $161,215 | $63,687 | $97,528 |
| 2014 | $2,104 | $158,059 | $62,441 | $95,618 |
Source: Public Records
Map
Nearby Homes
- 2466 Royal Ave
- 2675 Lembert St
- 2346 Royal Ave Unit 9
- 2709 Fitzgerald Rd
- 2327 Royal Ave
- 833 Crosby Ave
- 2277 Stinson St
- 2760 Royal Ave
- 2221 Fitzgerald Rd
- 835 Appleton Rd
- 1054 Currier Ave
- 2660 Rudolph Dr
- 2858 Fitzgerald Rd
- 2783 Fallon Cir
- 714 Appleton Rd
- 2049 Stanford Dr
- 2928 Royal Ave
- 619 Watson Ave
- 958 Breton St
- 3172 China Fir Place
- 1037 Sycamore Dr
- 1061 Sycamore Dr
- 2485 Lukens Ln
- 2492 Lukens Ln
- 1073 Sycamore Dr
- 1025 Sycamore Dr
- 2490 Invar Ct
- 1005 Treadwell Ave
- 2473 Lukens Ln
- 2478 Invar Ct
- 1060 Sycamore Dr
- 1017 Sycamore Dr
- 1085 Sycamore Dr
- 2491 Invar Ct
- 2484 Lukens Ln
- 1072 Sycamore Dr
- 1013 Treadwell Ave
- 1002 Treadwell Ave
- 2461 Lukens Ln
- 2472 Lukens Ln