105 Armstrong Ave Unit BRKLD Wilmington, DE 19805
Westminster NeighborhoodEstimated Value: $234,000 - $287,000
3
Beds
1
Bath
1,150
Sq Ft
$232/Sq Ft
Est. Value
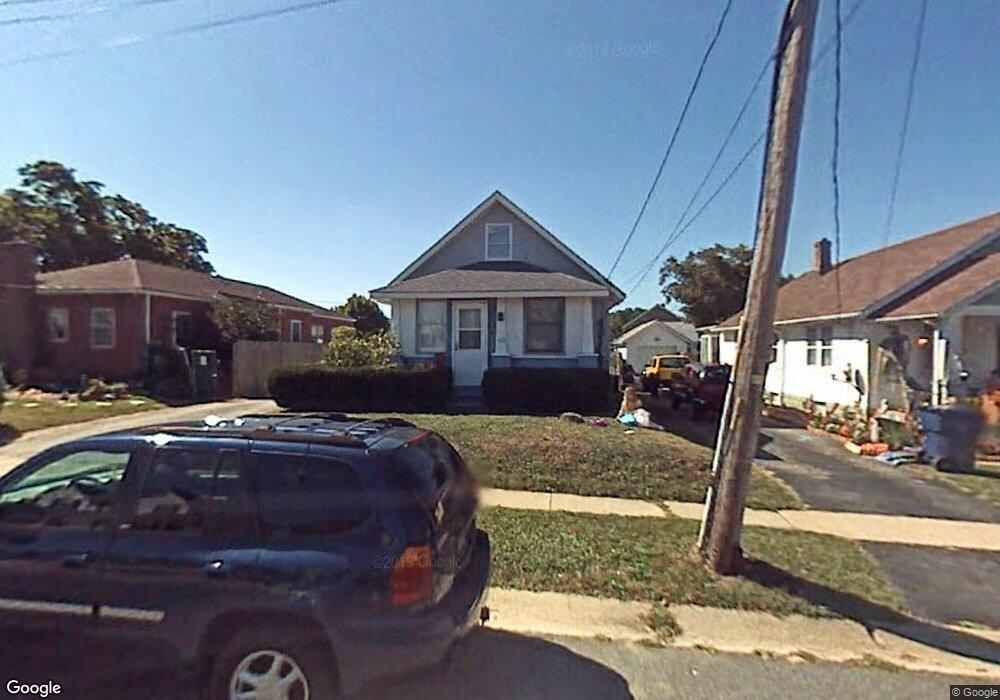
About This Home
This home is located at 105 Armstrong Ave Unit BRKLD, Wilmington, DE 19805 and is currently estimated at $267,062, approximately $232 per square foot. 105 Armstrong Ave Unit BRKLD is a home located in New Castle County with nearby schools including Marbrook Elementary School, Alexis I. du Pont Middle School, and Thomas McKean High School.
Ownership History
Date
Name
Owned For
Owner Type
Purchase Details
Closed on
Jan 6, 2023
Sold by
Mullins Rodman F
Bought by
Cullin Erin
Current Estimated Value
Home Financials for this Owner
Home Financials are based on the most recent Mortgage that was taken out on this home.
Original Mortgage
$208,160
Outstanding Balance
$201,699
Interest Rate
6.58%
Mortgage Type
FHA
Estimated Equity
$65,363
Purchase Details
Closed on
Feb 20, 2008
Sold by
Muellenberg Patricia A
Bought by
Mullins Rodman F
Home Financials for this Owner
Home Financials are based on the most recent Mortgage that was taken out on this home.
Original Mortgage
$133,500
Interest Rate
5.9%
Mortgage Type
Purchase Money Mortgage
Purchase Details
Closed on
May 12, 2005
Sold by
Farren Edward F
Bought by
Muellenberg David A and Mullins Rodman F
Create a Home Valuation Report for This Property
The Home Valuation Report is an in-depth analysis detailing your home's value as well as a comparison with similar homes in the area
Home Values in the Area
Average Home Value in this Area
Purchase History
| Date | Buyer | Sale Price | Title Company |
|---|---|---|---|
| Cullin Erin | -- | -- | |
| Mullins Rodman F | -- | None Available | |
| Muellenberg Patricia A | -- | None Available | |
| Muellenberg David A | $70,000 | -- |
Source: Public Records
Mortgage History
| Date | Status | Borrower | Loan Amount |
|---|---|---|---|
| Open | Cullin Erin | $208,160 | |
| Previous Owner | Mullins Rodman F | $133,500 | |
| Closed | Cullin Erin | $6,244 |
Source: Public Records
Tax History Compared to Growth
Tax History
| Year | Tax Paid | Tax Assessment Tax Assessment Total Assessment is a certain percentage of the fair market value that is determined by local assessors to be the total taxable value of land and additions on the property. | Land | Improvement |
|---|---|---|---|---|
| 2024 | $1,244 | $32,800 | $6,800 | $26,000 |
| 2023 | $1,101 | $32,800 | $6,800 | $26,000 |
| 2022 | $1,108 | $32,800 | $6,800 | $26,000 |
| 2021 | $1,108 | $32,800 | $6,800 | $26,000 |
| 2020 | $1,111 | $32,800 | $6,800 | $26,000 |
| 2019 | $1,275 | $32,800 | $6,800 | $26,000 |
| 2018 | $1,088 | $32,800 | $6,800 | $26,000 |
| 2017 | $1,075 | $32,800 | $6,800 | $26,000 |
| 2016 | $1,026 | $32,800 | $6,800 | $26,000 |
| 2015 | $962 | $32,800 | $6,800 | $26,000 |
| 2014 | $893 | $32,800 | $6,800 | $26,000 |
Source: Public Records
Map
Nearby Homes
- 10 Elliott Ave
- 7 Albertson Blvd
- 37 N Woodward Ave
- 5 Hawthorne Ave
- 513 Ohio Ave
- 2146 Elder Dr
- 1111 Wagoner Dr
- 3419 LOT 3 Old Capitol Trail
- 3419 LOT 2 Old Capitol Trail
- 3419 LOT 4 Old Capitol Trail
- 2500 Linkwood Ave
- 3423 Clayton Ave
- 0 Exmore Ave
- 102 Central Ave
- 0 Central Ave
- 2004 Faulkland Rd
- 101 Brighton Ave
- 1405 Brook Ln
- 116 Brookside Ave
- 1217 Newport Gap Pike
- 105 Armstrong Ave
- 101 Armstrong Ave
- 107 Armstrong Ave
- 9 Trenton Place
- 109 Armstrong Ave
- 7 Trenton Place
- 15 Trenton Place
- 104 Armstrong Ave
- 8 Albany Place
- 5 Trenton Place
- 100 Armstrong Ave
- 102 Armstrong Ave
- 200A Virginia Ave
- 200 Virginia Ave
- 4 Albany Place
- 3 Trenton Place
- 11 Albany Place
- 203 Armstrong Ave
- 2 Albany Place
- 202 Virginia Ave