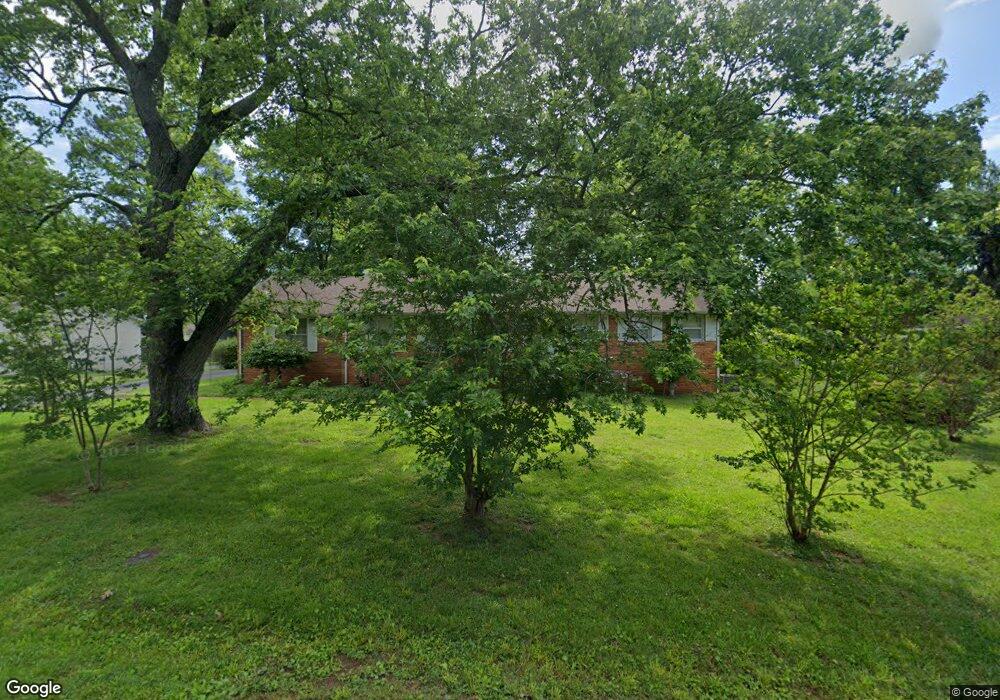
105 Burrum Dr Shelbyville, TN 37160
Estimated Value: $202,187 - $287,000
--
Bed
2
Baths
1,295
Sq Ft
$186/Sq Ft
Est. Value
About This Home
This home is located at 105 Burrum Dr, Shelbyville, TN 37160 and is currently estimated at $241,047, approximately $186 per square foot. 105 Burrum Dr is a home located in Bedford County with nearby schools including South Side Elementary School, Harris Middle School, and Christian Chapel Academy.
Ownership History
Date
Name
Owned For
Owner Type
Purchase Details
Closed on
Feb 27, 2004
Sold by
Bobo John T
Bought by
Vajcner Johnny
Current Estimated Value
Home Financials for this Owner
Home Financials are based on the most recent Mortgage that was taken out on this home.
Original Mortgage
$78,000
Outstanding Balance
$36,200
Interest Rate
5.68%
Estimated Equity
$204,847
Purchase Details
Closed on
Sep 25, 2003
Sold by
Norman Jerry
Bought by
Canter Keith
Purchase Details
Closed on
Nov 12, 1996
Sold by
Sanders Bobby G
Bought by
Norman Jerry L
Purchase Details
Closed on
Feb 21, 1996
Sold by
Lowe Lester
Bought by
Sanders Bobby G
Purchase Details
Closed on
Jul 26, 1983
Bought by
Lowe Lester and Lowe Evylin
Purchase Details
Closed on
Jul 15, 1983
Create a Home Valuation Report for This Property
The Home Valuation Report is an in-depth analysis detailing your home's value as well as a comparison with similar homes in the area
Home Values in the Area
Average Home Value in this Area
Purchase History
| Date | Buyer | Sale Price | Title Company |
|---|---|---|---|
| Vajcner Johnny | $78,000 | -- | |
| Canter Keith | $61,900 | -- | |
| Norman Jerry L | $65,000 | -- | |
| Sanders Bobby G | $56,750 | -- | |
| Lowe Lester | -- | -- | |
| -- | -- | -- |
Source: Public Records
Mortgage History
| Date | Status | Borrower | Loan Amount |
|---|---|---|---|
| Open | Not Available | $78,000 |
Source: Public Records
Tax History Compared to Growth
Tax History
| Year | Tax Paid | Tax Assessment Tax Assessment Total Assessment is a certain percentage of the fair market value that is determined by local assessors to be the total taxable value of land and additions on the property. | Land | Improvement |
|---|---|---|---|---|
| 2025 | -- | $32,350 | $0 | $0 |
| 2024 | -- | $32,350 | $6,250 | $26,100 |
| 2023 | $1,231 | $32,350 | $6,250 | $26,100 |
| 2022 | $1,266 | $32,350 | $6,250 | $26,100 |
| 2021 | $1,150 | $32,350 | $6,250 | $26,100 |
| 2020 | $951 | $32,350 | $6,250 | $26,100 |
| 2019 | $951 | $21,475 | $3,500 | $17,975 |
| 2018 | $930 | $21,475 | $3,500 | $17,975 |
| 2017 | $930 | $21,475 | $3,500 | $17,975 |
| 2016 | $921 | $21,475 | $3,500 | $17,975 |
| 2015 | $921 | $21,475 | $3,500 | $17,975 |
| 2014 | $829 | $21,143 | $0 | $0 |
Source: Public Records
Map
Nearby Homes
- 103 Burrum Dr
- 107 Burrum Dr
- 814 Shelbyview Dr
- 812 Shelbyview Dr
- 106 Burrum Dr
- 816 Shelbyview Dr
- 108 Burrum Dr
- 109 Burrum Dr
- 104 Burrum Dr
- 810 Shelbyview Dr
- 818 Shelbyview Dr
- 102 Burrum Dr
- 101 Burrum Dr
- 820 Shelbyview Dr
- 111 Burrum Dr
- 112 Burrum Dr
- 107 S Linda Dr
- 109 S Linda Dr
- 105 S Linda Dr
- 819 Shelbyview Dr