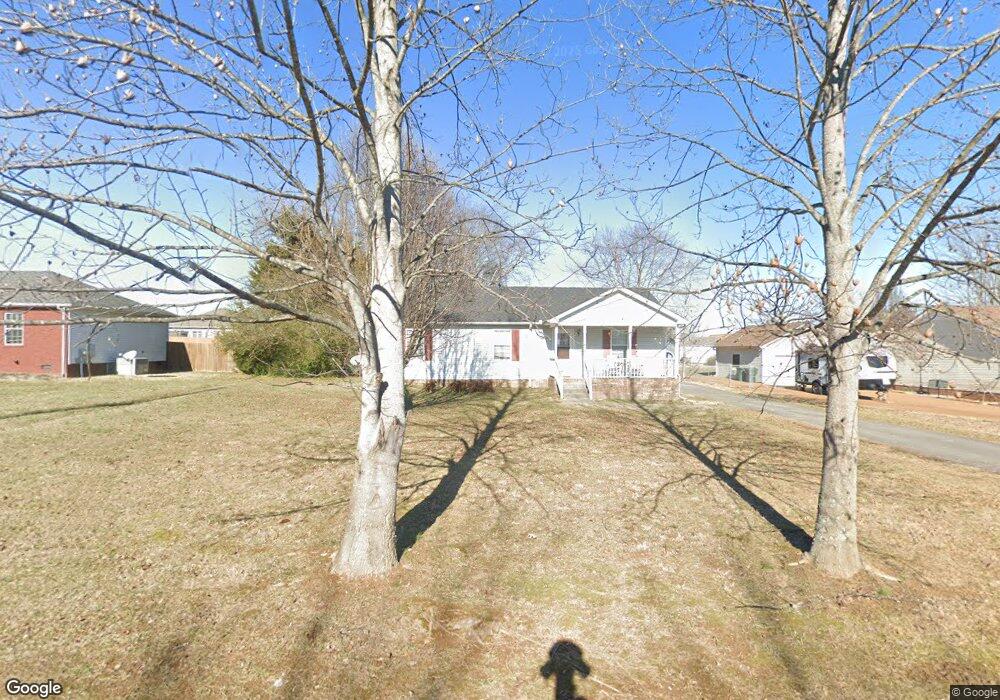
105 Hillcreek Ct Portland, TN 37148
Estimated Value: $254,000 - $298,000
--
Bed
2
Baths
1,222
Sq Ft
$226/Sq Ft
Est. Value
About This Home
This home is located at 105 Hillcreek Ct, Portland, TN 37148 and is currently estimated at $276,649, approximately $226 per square foot. 105 Hillcreek Ct is a home located in Sumner County with nearby schools including Portland Gateview Elementary School, Portland West Middle School, and Portland High School.
Ownership History
Date
Name
Owned For
Owner Type
Purchase Details
Closed on
Apr 1, 2025
Sold by
Johnson Revocable Trust and Johnson Eric
Bought by
Ten Hill Llc
Current Estimated Value
Purchase Details
Closed on
Jan 21, 2017
Sold by
Withers Helen Marina
Bought by
Withers Helen M
Purchase Details
Closed on
Jun 28, 2006
Sold by
Shuler David and Shuler Josephine
Bought by
Otzen Heinz
Home Financials for this Owner
Home Financials are based on the most recent Mortgage that was taken out on this home.
Original Mortgage
$55,179
Interest Rate
6.6%
Mortgage Type
Purchase Money Mortgage
Purchase Details
Closed on
Oct 29, 2002
Sold by
Porter Tammy L
Bought by
Shuler David L and Shuler Josephine
Purchase Details
Closed on
Jul 20, 1998
Sold by
Chip Gregory Construction Inc
Bought by
Porter Tammy L
Home Financials for this Owner
Home Financials are based on the most recent Mortgage that was taken out on this home.
Original Mortgage
$46,500
Interest Rate
7.02%
Create a Home Valuation Report for This Property
The Home Valuation Report is an in-depth analysis detailing your home's value as well as a comparison with similar homes in the area
Home Values in the Area
Average Home Value in this Area
Purchase History
| Date | Buyer | Sale Price | Title Company |
|---|---|---|---|
| Ten Hill Llc | -- | None Listed On Document | |
| Ten Hill Llc | -- | None Listed On Document | |
| Withers Helen M | -- | Tennessee Title Services Llc | |
| Otzen Heinz | $104,900 | Cumberland Title | |
| Shuler David L | $76,500 | -- | |
| Porter Tammy L | $76,500 | -- |
Source: Public Records
Mortgage History
| Date | Status | Borrower | Loan Amount |
|---|---|---|---|
| Previous Owner | Otzen Heinz | $55,179 | |
| Previous Owner | Porter Tammy L | $46,500 |
Source: Public Records
Tax History Compared to Growth
Tax History
| Year | Tax Paid | Tax Assessment Tax Assessment Total Assessment is a certain percentage of the fair market value that is determined by local assessors to be the total taxable value of land and additions on the property. | Land | Improvement |
|---|---|---|---|---|
| 2024 | $924 | $65,025 | $18,750 | $46,275 |
| 2023 | $1,274 | $37,350 | $8,000 | $29,350 |
| 2022 | $1,241 | $37,350 | $8,000 | $29,350 |
| 2021 | $1,241 | $37,350 | $8,000 | $29,350 |
| 2020 | $1,241 | $37,350 | $8,000 | $29,350 |
| 2019 | $1,690 | $0 | $0 | $0 |
| 2018 | $1,029 | $0 | $0 | $0 |
| 2017 | $976 | $0 | $0 | $0 |
| 2016 | $976 | $0 | $0 | $0 |
| 2015 | -- | $0 | $0 | $0 |
| 2014 | -- | $0 | $0 | $0 |
Source: Public Records
Map
Nearby Homes
- 107 Hillcreek Ct
- 103 Hillcreek Ct
- 402 Glen Haven Dr
- 109 Hillcreek Ct
- 101 Hillcreek Ct
- 140 Thacker Dr
- 102 Hillcreek Ct
- 138 Thacker Dr
- 106 Hillcreek Ct
- 404 Glen Haven Dr
- 136 Thacker Dr
- 136 Thacker Dr
- 100 Hillcreek Ct
- 111 Hillcreek Ct
- 108 Hillcreek Ct
- 134 Thacker Dr
- 103 Paigewood Dr
- 141 Thacker Dr
- 139 Thacker Dr
- 110 Hillcreek Ct