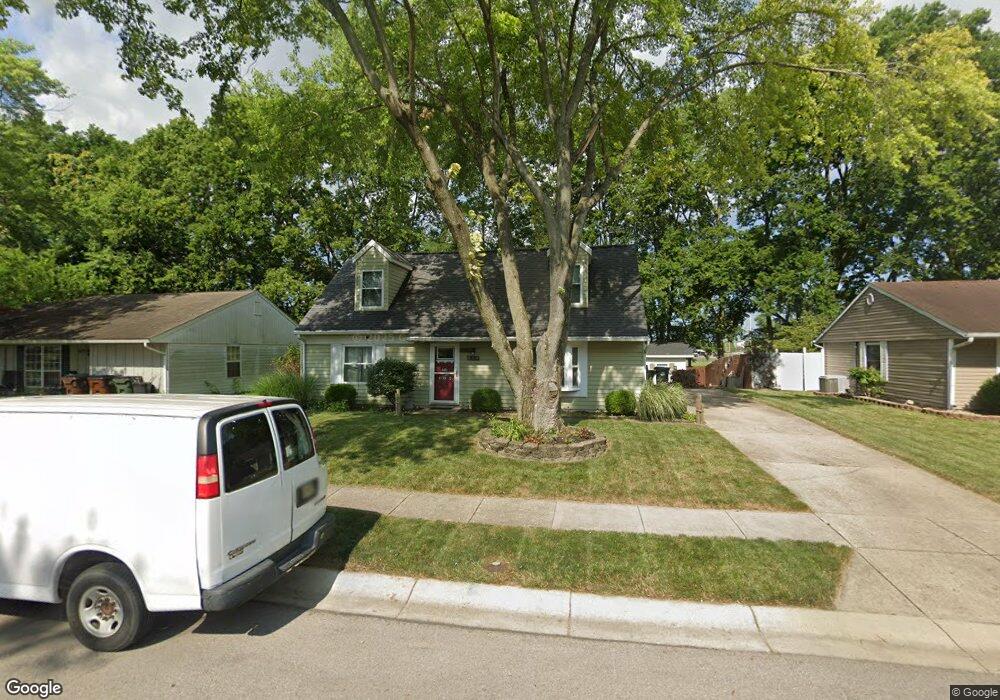
105 Minnick St Franklin, OH 45005
Estimated Value: $191,513 - $219,000
3
Beds
2
Baths
1,231
Sq Ft
$167/Sq Ft
Est. Value
About This Home
This home is located at 105 Minnick St, Franklin, OH 45005 and is currently estimated at $205,878, approximately $167 per square foot. 105 Minnick St is a home located in Warren County with nearby schools including Franklin High School and The CinDay Academy.
Ownership History
Date
Name
Owned For
Owner Type
Purchase Details
Closed on
Aug 22, 2005
Sold by
Va
Bought by
Johnson Russell D and Johnson Bobbi Jo Spoon
Current Estimated Value
Home Financials for this Owner
Home Financials are based on the most recent Mortgage that was taken out on this home.
Original Mortgage
$71,021
Outstanding Balance
$38,144
Interest Rate
6.01%
Mortgage Type
Fannie Mae Freddie Mac
Estimated Equity
$167,734
Purchase Details
Closed on
Mar 10, 2005
Sold by
Mortgage Electronic Registration Systems
Bought by
Va
Purchase Details
Closed on
Nov 21, 2003
Sold by
Howard Delbert and Howard Brenda
Bought by
Hill David E
Purchase Details
Closed on
Jul 21, 1989
Sold by
Howard Howard and Howard Rocky
Bought by
Howard Howard and Howard Delbert
Purchase Details
Closed on
Apr 10, 1989
Sold by
Howard Howard and Howard Delbert Brenda
Bought by
Howard Howard and Howard Rocky
Create a Home Valuation Report for This Property
The Home Valuation Report is an in-depth analysis detailing your home's value as well as a comparison with similar homes in the area
Home Values in the Area
Average Home Value in this Area
Purchase History
| Date | Buyer | Sale Price | Title Company |
|---|---|---|---|
| Johnson Russell D | -- | Fidelity Land Title Agency O | |
| Va | $86,897 | -- | |
| Hill David E | $103,900 | Republic Title | |
| Howard Howard | $32,000 | -- | |
| Howard Howard | $33,000 | -- |
Source: Public Records
Mortgage History
| Date | Status | Borrower | Loan Amount |
|---|---|---|---|
| Open | Johnson Russell D | $71,021 |
Source: Public Records
Tax History Compared to Growth
Tax History
| Year | Tax Paid | Tax Assessment Tax Assessment Total Assessment is a certain percentage of the fair market value that is determined by local assessors to be the total taxable value of land and additions on the property. | Land | Improvement |
|---|---|---|---|---|
| 2024 | $2,263 | $48,120 | $15,750 | $32,370 |
| 2023 | $1,865 | $35,560 | $9,684 | $25,875 |
| 2022 | $1,830 | $35,560 | $9,685 | $25,876 |
| 2021 | $1,735 | $35,560 | $9,685 | $25,876 |
| 2020 | $1,600 | $28,914 | $7,875 | $21,039 |
| 2019 | $1,455 | $28,914 | $7,875 | $21,039 |
| 2018 | $1,457 | $28,914 | $7,875 | $21,039 |
| 2017 | $1,492 | $27,090 | $7,480 | $19,611 |
| 2016 | $1,521 | $27,090 | $7,480 | $19,611 |
| 2015 | $1,521 | $27,090 | $7,480 | $19,611 |
| 2014 | $1,560 | $27,090 | $7,480 | $19,610 |
| 2013 | $1,322 | $31,690 | $8,750 | $22,940 |
Source: Public Records
Map
Nearby Homes
- 16 Harding Ct
- 718 Millard Dr
- 388 Thomas Dr
- 590 Kristine Ln
- 441 Sunnybrook Dr
- 445 Beam Dr
- 760 David Blvd
- 747 David Blvd
- 0 Kathy Ln Unit 1834240
- 0 Kathy Ln Unit 930066
- 121 E 5th St
- 995 E 4th St
- 519 Anderson St
- 111 Moore Dr
- 1200 Riley Blvd
- 4491 Michaels Dr
- 551 E 2nd St
- 164 Charles Ct
- 7 Highland St
- 0 E 4th St