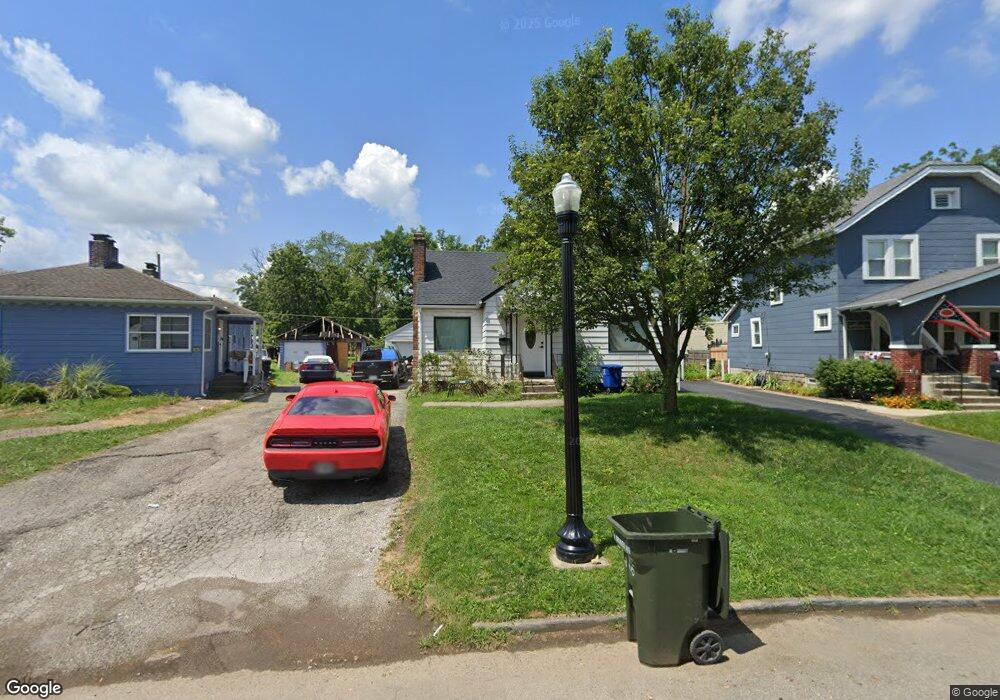
105 N Brinker Ave Columbus, OH 43204
North Hilltop NeighborhoodEstimated Value: $185,221 - $270,000
3
Beds
2
Baths
1,309
Sq Ft
$171/Sq Ft
Est. Value
About This Home
This home is located at 105 N Brinker Ave, Columbus, OH 43204 and is currently estimated at $223,305, approximately $170 per square foot. 105 N Brinker Ave is a home located in Franklin County with nearby schools including West Broad Elementary School, Westmoor Middle School, and West High School.
Ownership History
Date
Name
Owned For
Owner Type
Purchase Details
Closed on
Mar 16, 2007
Sold by
Jpmorgan Chase Bank Na
Bought by
Great City Homes Inc
Current Estimated Value
Home Financials for this Owner
Home Financials are based on the most recent Mortgage that was taken out on this home.
Original Mortgage
$93,750
Outstanding Balance
$39,733
Interest Rate
6.2%
Mortgage Type
Purchase Money Mortgage
Estimated Equity
$183,572
Purchase Details
Closed on
Oct 16, 2006
Sold by
Talbot John R and Wells Fargo Bank Na
Bought by
Jpmorgan Chase Bank Na and Ace 2002-He3
Purchase Details
Closed on
Aug 22, 2002
Sold by
Dreyfus Marsha J
Bought by
Talbot John R and Talbot Lisa A
Home Financials for this Owner
Home Financials are based on the most recent Mortgage that was taken out on this home.
Original Mortgage
$80,100
Interest Rate
8.75%
Mortgage Type
Purchase Money Mortgage
Purchase Details
Closed on
Feb 1, 1994
Bought by
Dreyfus Marsha J
Purchase Details
Closed on
May 15, 1989
Purchase Details
Closed on
Mar 9, 1989
Create a Home Valuation Report for This Property
The Home Valuation Report is an in-depth analysis detailing your home's value as well as a comparison with similar homes in the area
Home Values in the Area
Average Home Value in this Area
Purchase History
| Date | Buyer | Sale Price | Title Company |
|---|---|---|---|
| Great City Homes Inc | $60,000 | First Am | |
| Jpmorgan Chase Bank Na | $80,000 | None Available | |
| Talbot John R | $89,000 | Lawyers Title | |
| Dreyfus Marsha J | $53,000 | -- | |
| -- | -- | -- | |
| -- | -- | -- |
Source: Public Records
Mortgage History
| Date | Status | Borrower | Loan Amount |
|---|---|---|---|
| Open | Great City Homes Inc | $93,750 | |
| Previous Owner | Talbot John R | $80,100 |
Source: Public Records
Tax History Compared to Growth
Tax History
| Year | Tax Paid | Tax Assessment Tax Assessment Total Assessment is a certain percentage of the fair market value that is determined by local assessors to be the total taxable value of land and additions on the property. | Land | Improvement |
|---|---|---|---|---|
| 2024 | $3,405 | $49,740 | $9,000 | $40,740 |
| 2023 | $2,251 | $49,735 | $8,995 | $40,740 |
| 2022 | $2,181 | $26,330 | $6,760 | $19,570 |
| 2021 | $1,402 | $26,330 | $6,760 | $19,570 |
| 2020 | $1,404 | $26,330 | $6,760 | $19,570 |
| 2019 | $1,637 | $26,330 | $6,760 | $19,570 |
| 2018 | $1,691 | $35,780 | $6,760 | $29,020 |
| 2017 | $1,749 | $35,780 | $6,760 | $29,020 |
| 2016 | $1,275 | $18,760 | $7,280 | $11,480 |
| 2015 | $1,160 | $18,760 | $7,280 | $11,480 |
| 2014 | $1,706 | $18,760 | $7,280 | $11,480 |
| 2013 | $935 | $30,555 | $8,085 | $22,470 |
Source: Public Records
Map
Nearby Homes
- 113 N Brinker Ave Unit 115
- 119 N Westgate Ave
- 66 N Brinker Ave
- 3100 Steele Ave
- 160 N Sylvan Ave
- 32 Orel Ave
- 180 N Sylvan Ave
- 75 N Huron Ave
- 3096 Ellis Place
- 154-156 N Huron Ave
- 133 S Brinker Ave
- 43 Letchworth Ave
- 30 Demorest Rd
- 162 S Roys Ave
- 184 N Roys Ave
- 58 Binns Blvd
- 65 N Chase Ave
- 195 S Sylvan Ave
- 253 Powhatan Ave
- 267 S Westgate Ave
- 105 S Brinker Ave
- 109 N Brinker Ave
- 109 S Brinker Ave
- 93 N Brinker Ave
- 87 S Brinker Ave
- 87 N Brinker Ave
- 119 N Brinker Ave
- 83 N Brinker Ave
- 94 Orel Ave
- 102 N Brinker Ave Unit 104
- 131 N Brinker Ave
- 108 N Brinker Ave
- 77 N Brinker Ave
- 86 Orel Ave Unit 88
- 3123 Steele Ave
- 92 N Brinker Ave
- 82 Orel Ave Unit 84
- 88 N Brinker Ave
- 78 N Brinker Ave
- 78 Orel Ave