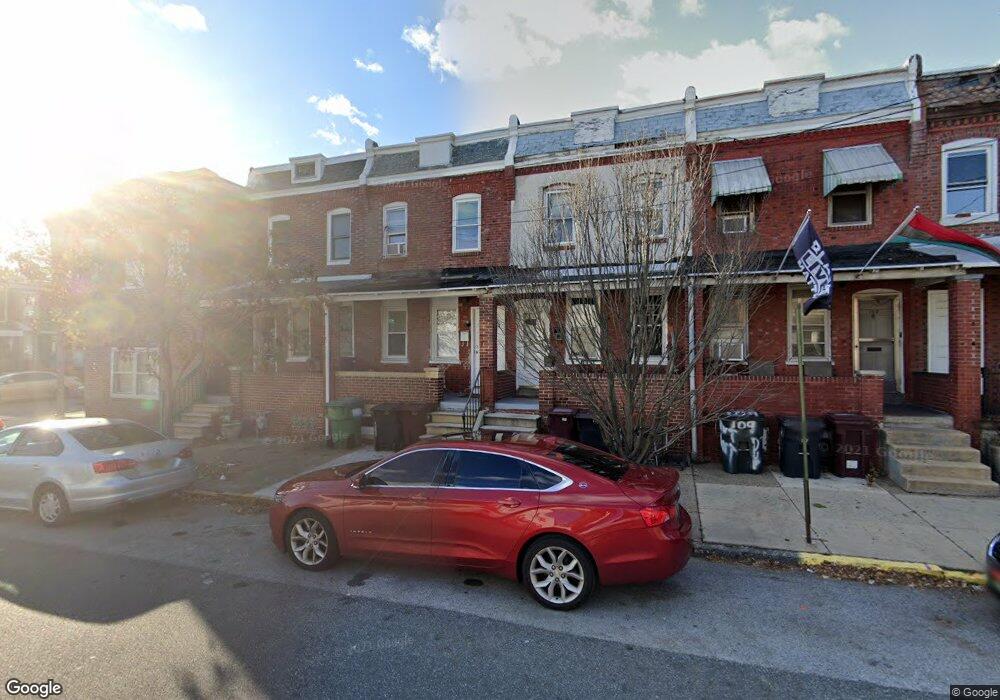
105 N Dupont St Wilmington, DE 19805
Estimated Value: $103,000 - $131,000
3
Beds
1
Bath
806
Sq Ft
$151/Sq Ft
Est. Value
About This Home
This home is located at 105 N Dupont St, Wilmington, DE 19805 and is currently estimated at $121,695, approximately $150 per square foot. 105 N Dupont St is a home located in New Castle County with nearby schools including Warner Elementary School, Dupont (H.B.) Middle School, and Alexis I. du Pont High School.
Ownership History
Date
Name
Owned For
Owner Type
Purchase Details
Closed on
Nov 30, 2007
Sold by
Kipp John Scott and Kipp Michele L
Bought by
Ortiz Jose and Ortiz Ana M
Current Estimated Value
Home Financials for this Owner
Home Financials are based on the most recent Mortgage that was taken out on this home.
Original Mortgage
$58,500
Outstanding Balance
$37,371
Interest Rate
6.48%
Mortgage Type
Purchase Money Mortgage
Estimated Equity
$84,324
Purchase Details
Closed on
Dec 7, 2004
Sold by
Kazi Sarwar I
Bought by
Kipp John Scott and Kipp Michele L
Home Financials for this Owner
Home Financials are based on the most recent Mortgage that was taken out on this home.
Original Mortgage
$53,600
Interest Rate
1.37%
Mortgage Type
New Conventional
Purchase Details
Closed on
Mar 27, 2002
Sold by
Meyer & Meyer Inc
Bought by
Kazi Sarwar I
Home Financials for this Owner
Home Financials are based on the most recent Mortgage that was taken out on this home.
Original Mortgage
$58,050
Interest Rate
6.88%
Purchase Details
Closed on
Oct 12, 2001
Sold by
Property Exchange Llc
Bought by
Meyer & Meyer Inc
Purchase Details
Closed on
Aug 29, 2001
Sold by
Carey Harmon R and Carey Claire L
Bought by
Property Exchange Llc
Create a Home Valuation Report for This Property
The Home Valuation Report is an in-depth analysis detailing your home's value as well as a comparison with similar homes in the area
Home Values in the Area
Average Home Value in this Area
Purchase History
| Date | Buyer | Sale Price | Title Company |
|---|---|---|---|
| Ortiz Jose | $65,000 | None Available | |
| Kipp John Scott | $67,000 | -- | |
| Kazi Sarwar I | -- | -- | |
| Meyer & Meyer Inc | -- | -- | |
| Property Exchange Llc | $10,250 | -- |
Source: Public Records
Mortgage History
| Date | Status | Borrower | Loan Amount |
|---|---|---|---|
| Open | Ortiz Jose | $58,500 | |
| Previous Owner | Kipp John Scott | $53,600 | |
| Previous Owner | Kazi Sarwar I | $58,050 |
Source: Public Records
Tax History Compared to Growth
Tax History
| Year | Tax Paid | Tax Assessment Tax Assessment Total Assessment is a certain percentage of the fair market value that is determined by local assessors to be the total taxable value of land and additions on the property. | Land | Improvement |
|---|---|---|---|---|
| 2024 | $552 | $17,700 | $2,400 | $15,300 |
| 2023 | $480 | $17,700 | $2,400 | $15,300 |
| 2022 | $482 | $17,700 | $2,400 | $15,300 |
| 2021 | $481 | $17,700 | $2,400 | $15,300 |
| 2020 | $484 | $17,700 | $2,400 | $15,300 |
| 2019 | $840 | $17,700 | $2,400 | $15,300 |
| 2018 | $482 | $17,700 | $2,400 | $15,300 |
| 2017 | $481 | $17,700 | $2,400 | $15,300 |
| 2016 | $456 | $17,700 | $2,400 | $15,300 |
| 2015 | $750 | $17,700 | $2,400 | $15,300 |
| 2014 | $712 | $17,700 | $2,400 | $15,300 |
Source: Public Records
Map
Nearby Homes
- 107 N Dupont St
- 103 N Dupont St
- 109 N Dupont St
- 111 N Dupont St
- 1703 Lancaster Ave
- 113 N Dupont St
- 1705 Lancaster Ave
- 115 N Dupont St
- 1707 Lancaster Ave
- 119 N Dupont St
- 121 N Dupont St
- 1637 Lancaster Ave
- 123 N Dupont St
- 1635 Lancaster Ave
- 3 S Dupont St
- 3 S Dupont St
- 125 N Dupont St
- 100 N Dupont St
- 102 N Dupont St
- 104 N Dupont St