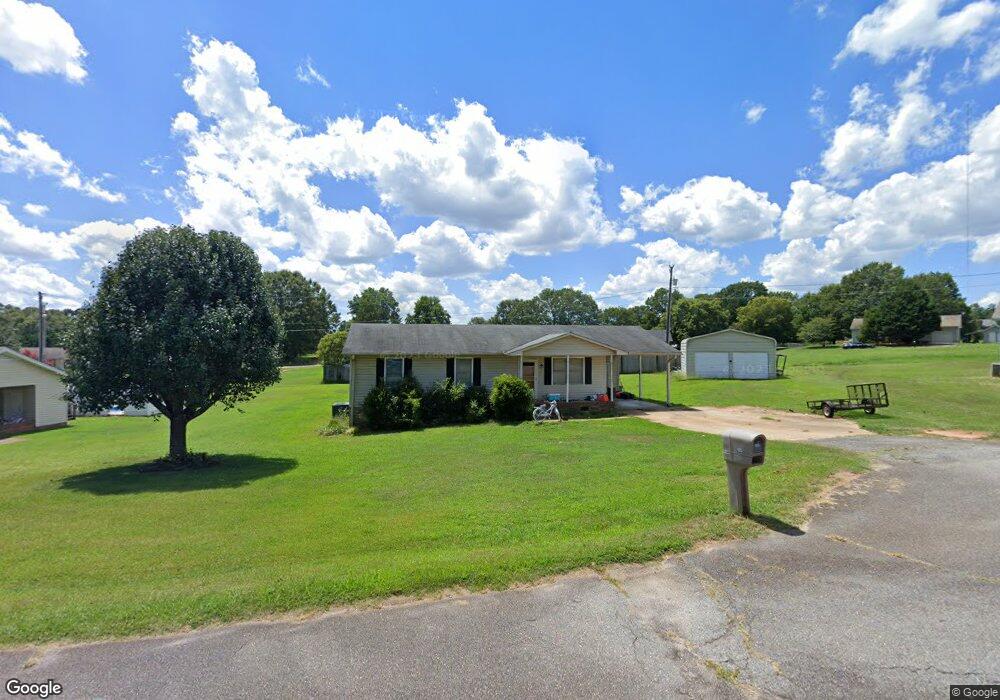
105 Spring Cir Anderson, SC 29621
Estimated Value: $217,000 - $234,000
3
Beds
2
Baths
1,100
Sq Ft
$206/Sq Ft
Est. Value
About This Home
This home is located at 105 Spring Cir, Anderson, SC 29621 and is currently estimated at $226,634, approximately $206 per square foot. 105 Spring Cir is a home located in Anderson County with nearby schools including Midway Elementary School, Glenview Middle School, and T.L. Hanna High School.
Ownership History
Date
Name
Owned For
Owner Type
Purchase Details
Closed on
Jul 10, 2017
Sold by
Matasavage Greg
Bought by
Foster Carnita S
Current Estimated Value
Home Financials for this Owner
Home Financials are based on the most recent Mortgage that was taken out on this home.
Original Mortgage
$90,000
Interest Rate
3.95%
Mortgage Type
New Conventional
Purchase Details
Closed on
Sep 23, 2013
Sold by
U S Bank National Association
Bought by
Matasavage Greg
Home Financials for this Owner
Home Financials are based on the most recent Mortgage that was taken out on this home.
Original Mortgage
$61,600
Interest Rate
4.53%
Mortgage Type
New Conventional
Purchase Details
Closed on
Sep 21, 2012
Sold by
Lasley James Carl
Bought by
U S Bank National Association
Purchase Details
Closed on
Jun 26, 2007
Sold by
Moore Douglas C and Moore Gail P
Bought by
Lasley James Carl
Create a Home Valuation Report for This Property
The Home Valuation Report is an in-depth analysis detailing your home's value as well as a comparison with similar homes in the area
Home Values in the Area
Average Home Value in this Area
Purchase History
| Date | Buyer | Sale Price | Title Company |
|---|---|---|---|
| Foster Carnita S | $125,000 | None Available | |
| Matasavage Greg | $77,000 | -- | |
| U S Bank National Association | $85,235 | -- | |
| Lasley James Carl | $79,000 | Attorney |
Source: Public Records
Mortgage History
| Date | Status | Borrower | Loan Amount |
|---|---|---|---|
| Previous Owner | Foster Carnita S | $90,000 | |
| Previous Owner | Matasavage Greg | $61,600 |
Source: Public Records
Tax History
| Year | Tax Paid | Tax Assessment Tax Assessment Total Assessment is a certain percentage of the fair market value that is determined by local assessors to be the total taxable value of land and additions on the property. | Land | Improvement |
|---|---|---|---|---|
| 2024 | $759 | $6,210 | $620 | $5,590 |
| 2023 | $762 | $6,210 | $620 | $5,590 |
| 2022 | $731 | $6,210 | $620 | $5,590 |
| 2021 | $655 | $5,110 | $400 | $4,710 |
| 2020 | $2,527 | $7,660 | $600 | $7,060 |
| 2019 | $2,527 | $7,660 | $600 | $7,060 |
| 2018 | $2,493 | $7,660 | $600 | $7,060 |
| 2017 | -- | $3,500 | $400 | $3,100 |
| 2016 | $470 | $3,460 | $300 | $3,160 |
| 2015 | $478 | $3,460 | $300 | $3,160 |
| 2014 | $474 | $5,190 | $450 | $4,740 |
Source: Public Records
Map
Nearby Homes
- 2301 Rolling Green Rd
- 223 Maple Dr
- 420 Fox Valley Rd
- 410 van Martin Rd
- 1118 Gilreath Rd
- 2414 Old Williamston Rd
- 2703 Dellwood Ln
- 103 Charlestowne Way
- 118 Augusta National
- 129 Golden Eagle Ln
- 102 Olivarri Dr
- 116 Augusta National
- 136 Amberwood Dr
- 707 Kay Dr
- 2403 Warriors Path
- 111 Abigail Ln
- 109 Abigail Ln
- 16 Oleander Dr
- 129 Saint James Ct
- 115 Dundee Ct
- 105 Spring Cir
- 105 Spring Cir Unit 105 Spring Circle
- 103 Spring Cir
- 107 Spring St
- 2204 Rolling Green Rd
- 2206 Rolling Green Rd
- 107 Spring Cir
- 2202 Rolling Green Rd
- 104 Spring St
- 2200 Rolling Green Rd
- 104 Spring Cir
- 108 Spring Cir
- 102 Spring Cir
- 100 Spring Cir
- 214 Maple Dr
- 212 Maple Dr
- 216 Maple Dr
- 2306 Rolling Green Rd
- 210 Maple Dr
- 2203 Rolling Green Rd
Your Personal Tour Guide
Ask me questions while you tour the home.