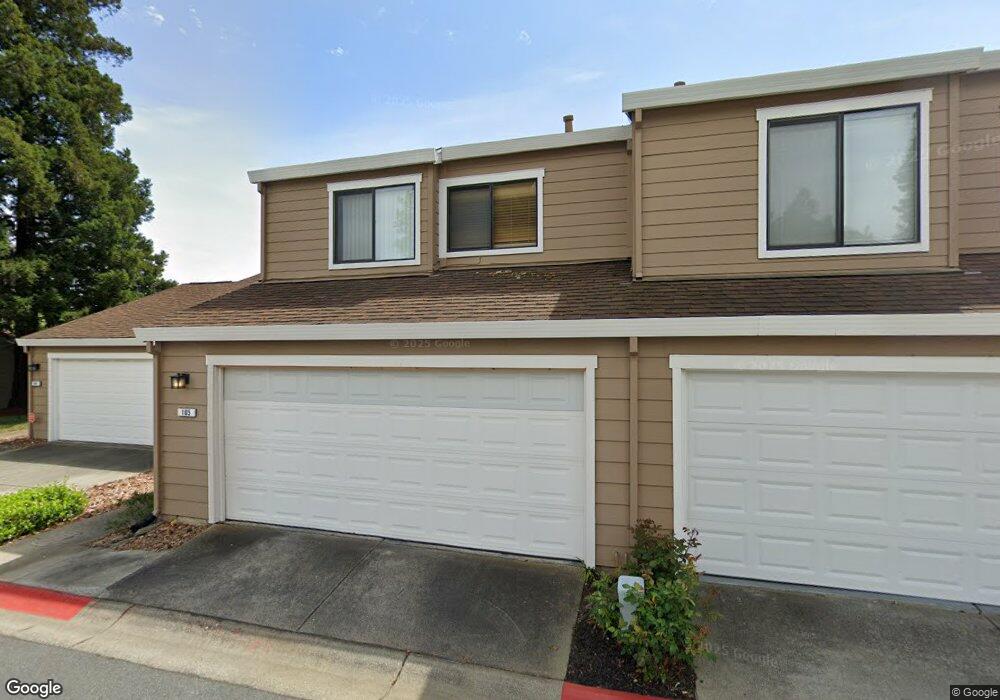
105 Worthing Hercules, CA 94547
Foxboro NeighborhoodEstimated Value: $545,000 - $645,000
3
Beds
3
Baths
1,393
Sq Ft
$416/Sq Ft
Est. Value
About This Home
This home is located at 105 Worthing, Hercules, CA 94547 and is currently estimated at $579,562, approximately $416 per square foot. 105 Worthing is a home located in Contra Costa County with nearby schools including Rodeo Hills Elementary School, Carquinez Middle School, and John Swett High School.
Ownership History
Date
Name
Owned For
Owner Type
Purchase Details
Closed on
Oct 26, 2009
Sold by
Wachovia Mortgage Fsb
Bought by
Newfield Stephen and Newfield Olivia
Current Estimated Value
Purchase Details
Closed on
Jun 26, 2009
Sold by
Griffith Mae D
Bought by
Wachovia Mortgage Fsb
Purchase Details
Closed on
Oct 29, 2003
Sold by
Carraway Derrick and Carraway Rhonda
Bought by
Griffith Mae D
Home Financials for this Owner
Home Financials are based on the most recent Mortgage that was taken out on this home.
Original Mortgage
$48,750
Interest Rate
5.98%
Mortgage Type
Credit Line Revolving
Purchase Details
Closed on
May 1, 1998
Sold by
Holsinger Robert P and Holsinger Colleen K
Bought by
Carraway Derrick and Carraway Rhonda
Home Financials for this Owner
Home Financials are based on the most recent Mortgage that was taken out on this home.
Original Mortgage
$132,950
Interest Rate
7.13%
Mortgage Type
Purchase Money Mortgage
Create a Home Valuation Report for This Property
The Home Valuation Report is an in-depth analysis detailing your home's value as well as a comparison with similar homes in the area
Home Values in the Area
Average Home Value in this Area
Purchase History
| Date | Buyer | Sale Price | Title Company |
|---|---|---|---|
| Newfield Stephen | $210,000 | Chicago Title Company | |
| Wachovia Mortgage Fsb | $171,380 | Accommodation | |
| Griffith Mae D | $325,000 | Chicago Title | |
| Carraway Derrick | $140,000 | First American Title Guarant |
Source: Public Records
Mortgage History
| Date | Status | Borrower | Loan Amount |
|---|---|---|---|
| Previous Owner | Griffith Mae D | $48,750 | |
| Previous Owner | Carraway Derrick | $132,950 | |
| Closed | Carraway Derrick | $132,950 | |
| Closed | Griffith Mae D | $260,000 |
Source: Public Records
Tax History
| Year | Tax Paid | Tax Assessment Tax Assessment Total Assessment is a certain percentage of the fair market value that is determined by local assessors to be the total taxable value of land and additions on the property. | Land | Improvement |
|---|---|---|---|---|
| 2025 | $4,507 | $271,061 | $51,627 | $219,434 |
| 2024 | $4,308 | $265,747 | $50,615 | $215,132 |
| 2023 | $4,308 | $260,537 | $49,623 | $210,914 |
| 2022 | $4,299 | $255,429 | $48,650 | $206,779 |
| 2021 | $4,221 | $250,422 | $47,697 | $202,725 |
| 2019 | $4,130 | $242,996 | $46,283 | $196,713 |
| 2018 | $4,025 | $238,232 | $45,376 | $192,856 |
| 2017 | $3,968 | $233,562 | $44,487 | $189,075 |
| 2016 | $3,622 | $228,983 | $43,615 | $185,368 |
| 2015 | $3,587 | $225,544 | $42,960 | $182,584 |
| 2014 | $3,664 | $221,127 | $42,119 | $179,008 |
Source: Public Records
Map
Nearby Homes
- 720 Seacliff Ct
- 405 Weymouth
- 704 Windsor Unit 704
- 802 Dover
- 801 Dover
- 120 Bonita Ct
- 176 Bedford
- 1101 Chelsea
- 797 Coral Ridge Cir
- 834 Coral Ridge Cir
- 938 Sandy Cove Dr
- 900 Seascape Cir
- 922 Coral Dr
- 836 Hawthorne Dr
- 1012 Salt Spray Terrace
- 1723 Pheasant Dr
- 1407 Forest Run
- 1405 Forest Run
- 211 Meadowlark Way
- 3198 S Front St
Your Personal Tour Guide
Ask me questions while you tour the home.