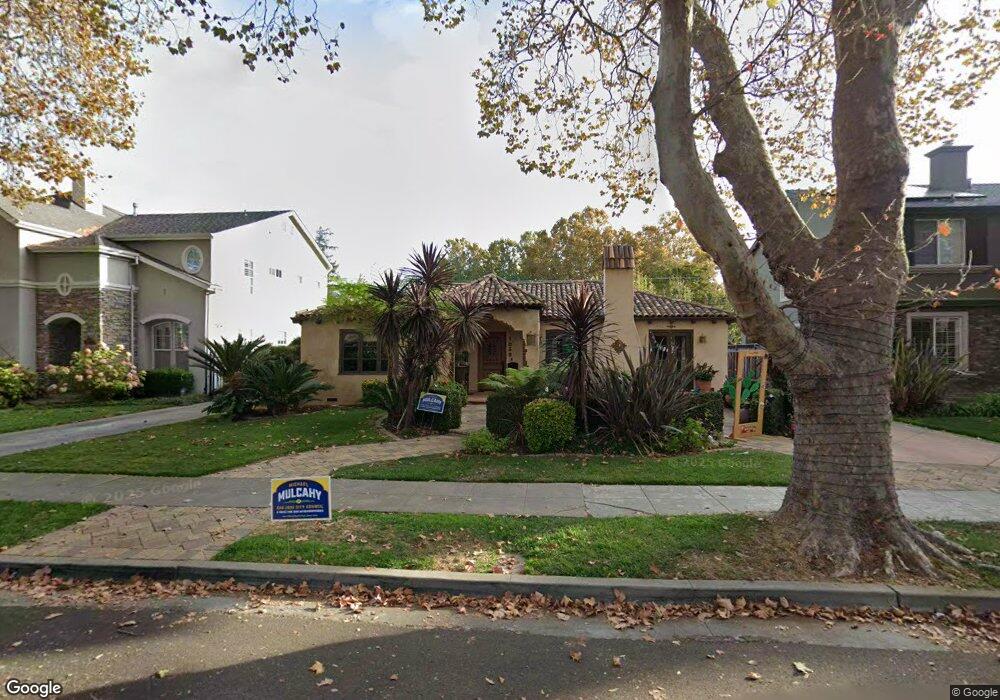
1050 Camino Pablo San Jose, CA 95125
Willow Glen NeighborhoodEstimated Value: $2,133,000 - $2,298,000
2
Beds
2
Baths
1,532
Sq Ft
$1,438/Sq Ft
Est. Value
About This Home
This home is located at 1050 Camino Pablo, San Jose, CA 95125 and is currently estimated at $2,202,495, approximately $1,437 per square foot. 1050 Camino Pablo is a home located in Santa Clara County with nearby schools including Willow Glen Elementary, Willow Glen Middle, and Willow Glen High School.
Ownership History
Date
Name
Owned For
Owner Type
Purchase Details
Closed on
Jun 9, 2021
Sold by
Ruvalcaba Emily V
Bought by
Ruvalcaba Emily V and Emily V Ruvalcaba Revocable Tr
Current Estimated Value
Purchase Details
Closed on
Apr 11, 2013
Sold by
Leslie Gail L
Bought by
Ruvalcaba Emily
Home Financials for this Owner
Home Financials are based on the most recent Mortgage that was taken out on this home.
Original Mortgage
$600,000
Outstanding Balance
$414,386
Interest Rate
3%
Mortgage Type
Adjustable Rate Mortgage/ARM
Estimated Equity
$1,788,109
Purchase Details
Closed on
Jun 5, 2006
Sold by
Leslie Gail L
Bought by
Leslie Gail L
Purchase Details
Closed on
Oct 20, 2003
Sold by
Cramer Kendon and Cramer Evelyn
Bought by
Leslie Gail L
Home Financials for this Owner
Home Financials are based on the most recent Mortgage that was taken out on this home.
Original Mortgage
$429,000
Interest Rate
4.31%
Mortgage Type
Balloon
Create a Home Valuation Report for This Property
The Home Valuation Report is an in-depth analysis detailing your home's value as well as a comparison with similar homes in the area
Home Values in the Area
Average Home Value in this Area
Purchase History
| Date | Buyer | Sale Price | Title Company |
|---|---|---|---|
| Ruvalcaba Emily V | -- | None Available | |
| Ruvalcaba Emily V | -- | None Available | |
| Ruvalcaba Emily | $1,200,000 | Fidelity National Title Co | |
| Leslie Gail L | -- | None Available | |
| Leslie Gail L | $619,000 | North American Title Co |
Source: Public Records
Mortgage History
| Date | Status | Borrower | Loan Amount |
|---|---|---|---|
| Open | Ruvalcaba Emily | $600,000 | |
| Previous Owner | Leslie Gail L | $429,000 |
Source: Public Records
Tax History Compared to Growth
Tax History
| Year | Tax Paid | Tax Assessment Tax Assessment Total Assessment is a certain percentage of the fair market value that is determined by local assessors to be the total taxable value of land and additions on the property. | Land | Improvement |
|---|---|---|---|---|
| 2025 | $18,211 | $1,477,701 | $911,251 | $566,450 |
| 2024 | $18,211 | $1,448,728 | $893,384 | $555,344 |
| 2023 | $17,889 | $1,420,322 | $875,867 | $544,455 |
| 2022 | $17,736 | $1,392,474 | $858,694 | $533,780 |
| 2021 | $17,407 | $1,365,171 | $841,857 | $523,314 |
| 2020 | $17,043 | $1,351,174 | $833,225 | $517,949 |
| 2019 | $16,696 | $1,324,682 | $816,888 | $507,794 |
| 2018 | $16,545 | $1,298,709 | $800,871 | $497,838 |
| 2017 | $16,422 | $1,273,245 | $785,168 | $488,077 |
| 2016 | $16,201 | $1,248,280 | $769,773 | $478,507 |
| 2015 | $16,106 | $1,229,531 | $758,211 | $471,320 |
| 2014 | $15,617 | $1,205,447 | $743,359 | $462,088 |
Source: Public Records
Map
Nearby Homes
- 975 Cherry Ave
- 1070 Shelton Way
- 1192 Crescent Dr
- 1133 Garfield Ave
- 1321 Fruitdale Ave
- 1232 Coolidge Ave
- 1044 Lincoln Ave
- 1071 Merle Ave
- 1503 Willowhaven Ct
- 1522 Mckinley Ave
- 1242 Minnesota Ave
- 1265 Blewett Ave
- 935 Chabrant Way
- 960 Lakeshire Ct
- 1344 Iris Ct
- 943 Riverside Dr
- 883 Riverside Dr
- 1751 Willow St
- 747 Coe Ave
- 1485 De Rose Way Unit 123
- 1044 Camino Pablo
- 1056 Camino Pablo
- 1051 Cherry Ave
- 1055 Cherry Ave
- 1062 Camino Pablo
- 1038 Camino Pablo
- 1045 Cherry Ave
- 1063 Cherry Ave
- 1049 Camino Pablo
- 1055 Camino Pablo
- 1043 Camino Pablo
- 1068 Camino Pablo
- 1039 Cherry Ave
- 1032 Camino Pablo
- 1069 Cherry Ave
- 1061 Camino Pablo
- 1037 Camino Pablo
- 1033 Cherry Ave
- 1074 Camino Pablo
- 1067 Camino Pablo