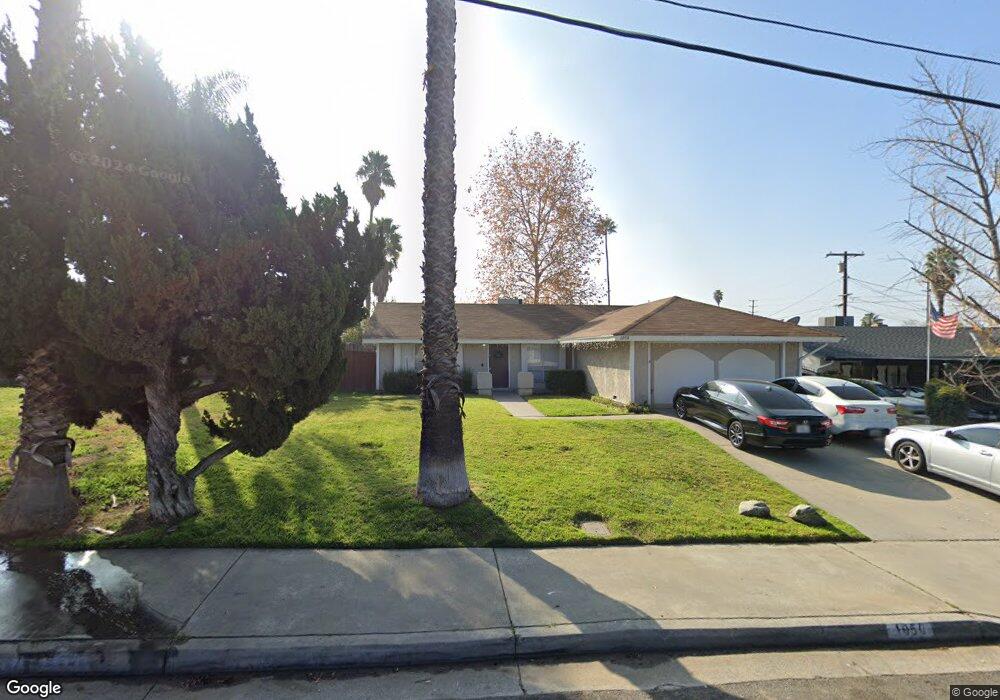
1050 Massachusetts Ave Riverside, CA 92507
University NeighborhoodEstimated Value: $525,167 - $552,000
3
Beds
2
Baths
1,144
Sq Ft
$473/Sq Ft
Est. Value
About This Home
This home is located at 1050 Massachusetts Ave, Riverside, CA 92507 and is currently estimated at $540,792, approximately $472 per square foot. 1050 Massachusetts Ave is a home located in Riverside County with nearby schools including Highland Elementary, University Heights Middle School, and John W. North High School.
Ownership History
Date
Name
Owned For
Owner Type
Purchase Details
Closed on
Dec 9, 2019
Sold by
Riley Jason P and Richard E Riley Family Trust
Bought by
Riley Jason P
Current Estimated Value
Purchase Details
Closed on
Nov 24, 2008
Sold by
Riley Richard Elvin
Bought by
Riley Richard E and Riley Jason P
Purchase Details
Closed on
Jan 22, 2007
Sold by
Riley Creola Faye
Bought by
Riley Richard E
Purchase Details
Closed on
Aug 19, 1998
Sold by
Richman Karen L
Bought by
Richman Michael H
Create a Home Valuation Report for This Property
The Home Valuation Report is an in-depth analysis detailing your home's value as well as a comparison with similar homes in the area
Home Values in the Area
Average Home Value in this Area
Purchase History
We collect this data history from publicly available records. To have your information removed, we recommend requesting removal directly through your county’s website.
| Date | Buyer | Sale Price | Title Company |
|---|---|---|---|
| Riley Jason P | -- | None Available | |
| Riley Richard E | -- | None Available | |
| Riley Richard E | -- | None Available | |
| Richman Michael H | -- | First American Title Co |
Source: Public Records
Tax History
| Year | Tax Paid | Tax Assessment Tax Assessment Total Assessment is a certain percentage of the fair market value that is determined by local assessors to be the total taxable value of land and additions on the property. | Land | Improvement |
|---|---|---|---|---|
| 2025 | $1,637 | $146,386 | $48,787 | $97,599 |
| 2023 | $1,637 | $140,704 | $46,894 | $93,810 |
| 2022 | $1,601 | $137,946 | $45,975 | $91,971 |
| 2021 | $1,593 | $135,242 | $45,074 | $90,168 |
| 2020 | $1,581 | $133,856 | $44,612 | $89,244 |
| 2019 | $1,552 | $131,232 | $43,737 | $87,495 |
| 2018 | $1,523 | $128,660 | $42,880 | $85,780 |
| 2017 | $1,497 | $126,139 | $42,040 | $84,099 |
| 2016 | $1,404 | $123,666 | $41,216 | $82,450 |
| 2015 | $1,384 | $121,810 | $40,598 | $81,212 |
| 2014 | $1,371 | $119,425 | $39,803 | $79,622 |
Source: Public Records
Map
Nearby Homes
- 1065 Bascomb Dr
- 1110 W Blaine St Unit 102
- 1110 W Blaine St Unit 107
- 1130 W Blaine St Unit 204
- 1136 W Blaine St Unit 203
- 1305 Massachusetts Ave Unit 205
- 1329 Massachusetts Ave Unit 202
- 770 Libby Dr
- 1337 Massachusetts Ave Unit 204
- 1390 Clemson Way
- 657 Glenhill Dr
- 1333 Wheaton Way
- 104 Sir Tristram Dr Unit 104
- 1560 Massachusetts Ave Unit 123
- 1560 Massachusetts Ave
- 1560 Massachusetts Ave Unit 96
- 1560 Massachusetts Ave Unit 94
- 46 Round Table Dr
- 2510 Cloudcrest Way
- 2561 Gonzaga Ln Unit 176
- 1040 Massachusetts Ave
- 1060 Massachusetts Ave
- 1051 Minerva Ct
- 1041 Minerva Ct
- 1030 Massachusetts Ave
- 1061 Minerva Ct
- 1070 Massachusetts Ave
- 1031 Minerva Ct
- 1045 Massachusetts Ave
- 1055 Massachusetts Ave
- 1071 Minerva Ct
- 1035 Massachusetts Ave
- 1020 Massachusetts Ave
- 1065 Massachusetts Ave
- 1080 Massachusetts Ave
- 1021 Minerva Ct
- 1081 Minerva Ct
- 1075 Massachusetts Ave
- 1010 Massachusetts Ave
- 1050 Minerva Ct
Your Personal Tour Guide
Ask me questions while you tour the home.