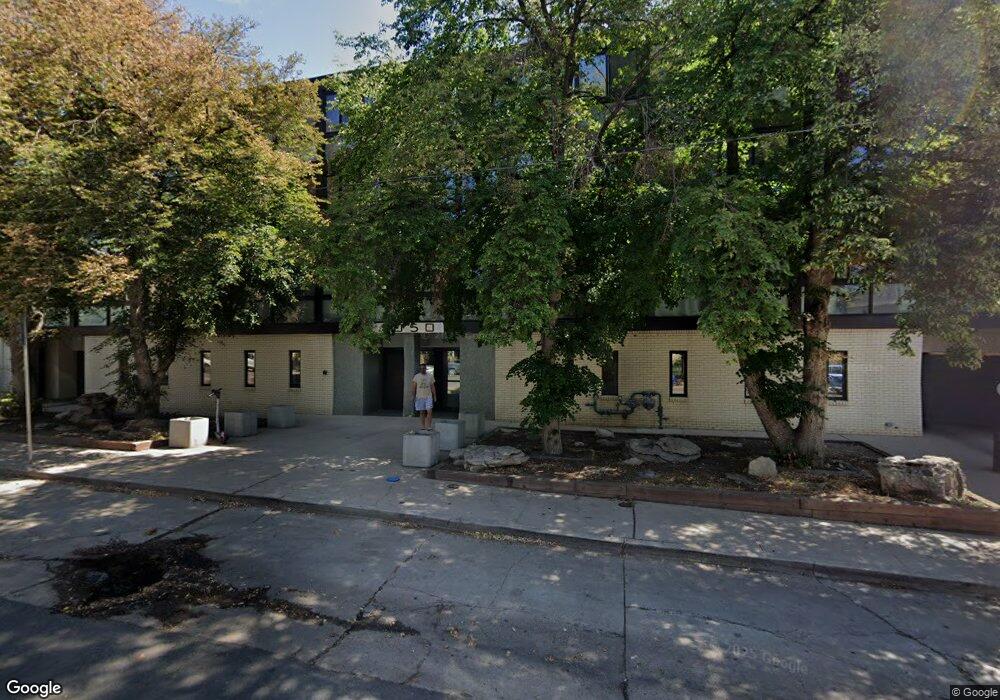
1050 N Corona St Unit 315 Denver, CO 80218
Capitol Hill NeighborhoodEstimated Value: $254,448 - $281,000
1
Bed
1
Bath
710
Sq Ft
$375/Sq Ft
Est. Value
About This Home
This home is located at 1050 N Corona St Unit 315, Denver, CO 80218 and is currently estimated at $266,362, approximately $375 per square foot. 1050 N Corona St Unit 315 is a home located in Denver County with nearby schools including Dora Moore ECE-8 School, Morey Middle School, and East High School.
Ownership History
Date
Name
Owned For
Owner Type
Purchase Details
Closed on
May 2, 2011
Sold by
Trombley Matthew A
Bought by
Mortensen Thomas J
Current Estimated Value
Home Financials for this Owner
Home Financials are based on the most recent Mortgage that was taken out on this home.
Original Mortgage
$94,500
Outstanding Balance
$65,643
Interest Rate
4.87%
Mortgage Type
New Conventional
Estimated Equity
$200,719
Purchase Details
Closed on
Aug 26, 2005
Sold by
Mora Jeremiah
Bought by
Trombley Matthew A
Home Financials for this Owner
Home Financials are based on the most recent Mortgage that was taken out on this home.
Original Mortgage
$108,300
Interest Rate
5.81%
Mortgage Type
FHA
Purchase Details
Closed on
Nov 27, 2001
Sold by
Rossi Kenneth A
Bought by
Mora Jeremiah
Home Financials for this Owner
Home Financials are based on the most recent Mortgage that was taken out on this home.
Original Mortgage
$87,300
Interest Rate
6.59%
Mortgage Type
FHA
Create a Home Valuation Report for This Property
The Home Valuation Report is an in-depth analysis detailing your home's value as well as a comparison with similar homes in the area
Home Values in the Area
Average Home Value in this Area
Purchase History
| Date | Buyer | Sale Price | Title Company |
|---|---|---|---|
| Mortensen Thomas J | $105,000 | Guardian Title | |
| Trombley Matthew A | $114,000 | Land Title | |
| Mora Jeremiah | $90,000 | -- |
Source: Public Records
Mortgage History
| Date | Status | Borrower | Loan Amount |
|---|---|---|---|
| Open | Mortensen Thomas J | $94,500 | |
| Previous Owner | Trombley Matthew A | $108,300 | |
| Previous Owner | Mora Jeremiah | $87,300 |
Source: Public Records
Tax History Compared to Growth
Tax History
| Year | Tax Paid | Tax Assessment Tax Assessment Total Assessment is a certain percentage of the fair market value that is determined by local assessors to be the total taxable value of land and additions on the property. | Land | Improvement |
|---|---|---|---|---|
| 2024 | $1,316 | $16,610 | $1,970 | $14,640 |
| 2023 | $1,287 | $16,610 | $1,970 | $14,640 |
| 2022 | $1,345 | $16,910 | $2,040 | $14,870 |
| 2021 | $1,345 | $17,400 | $2,100 | $15,300 |
| 2020 | $1,214 | $16,360 | $1,970 | $14,390 |
| 2019 | $1,180 | $16,360 | $1,970 | $14,390 |
| 2018 | $1,084 | $14,010 | $1,860 | $12,150 |
| 2017 | $1,081 | $14,010 | $1,860 | $12,150 |
| 2016 | $874 | $10,720 | $1,902 | $8,818 |
| 2015 | $838 | $10,720 | $1,902 | $8,818 |
| 2014 | $623 | $7,500 | $1,377 | $6,123 |
Source: Public Records
Map
Nearby Homes
- 1008 N Corona St Unit 604
- 1050 N Corona St Unit 314
- 1050 N Corona St Unit 216
- 1050 N Corona St Unit 105
- 1050 N Corona St Unit 308
- 1050 N Corona St Unit 215
- 1035 E 10th Ave Unit 6
- 1010 N Downing St Unit 5
- 1013 E 10th Ave Unit 1013
- 985 Corona St Unit 203
- 951 N Corona St Unit 5
- 1111 Corona St
- 1140 N Downing St Unit 103
- 1057 N Emerson St Unit B
- 1006 E 9th Ave
- 1151 N Marion St Unit 104
- 1167 N Downing St
- 931 Emerson St Unit 1
- 1090 N Lafayette St Unit 503
- 1217 N Downing St Unit 4
- 1050 N Corona St Unit 116
- 1050 N Corona St Unit 210
- 1050 N Corona St Unit 303
- 1050 N Corona St Unit 209
- 1050 N Corona St Unit 205
- 1050 N Corona St Unit 107
- 1050 N Corona St Unit 201
- 1050 N Corona St Unit 317
- 1050 N Corona St Unit 206
- 1050 N Corona St Unit 214
- 1050 N Corona St Unit 316
- 1050 N Corona St Unit 101
- 1050 N Corona St Unit 111
- 1050 N Corona St Unit 211
- 1050 N Corona St
- 1050 N Corona St Unit 212
- 1050 N Corona St Unit 202
- 1050 N Corona St Unit 301
- 1050 N Corona St Unit 117
- 1050 N Corona St Unit 115