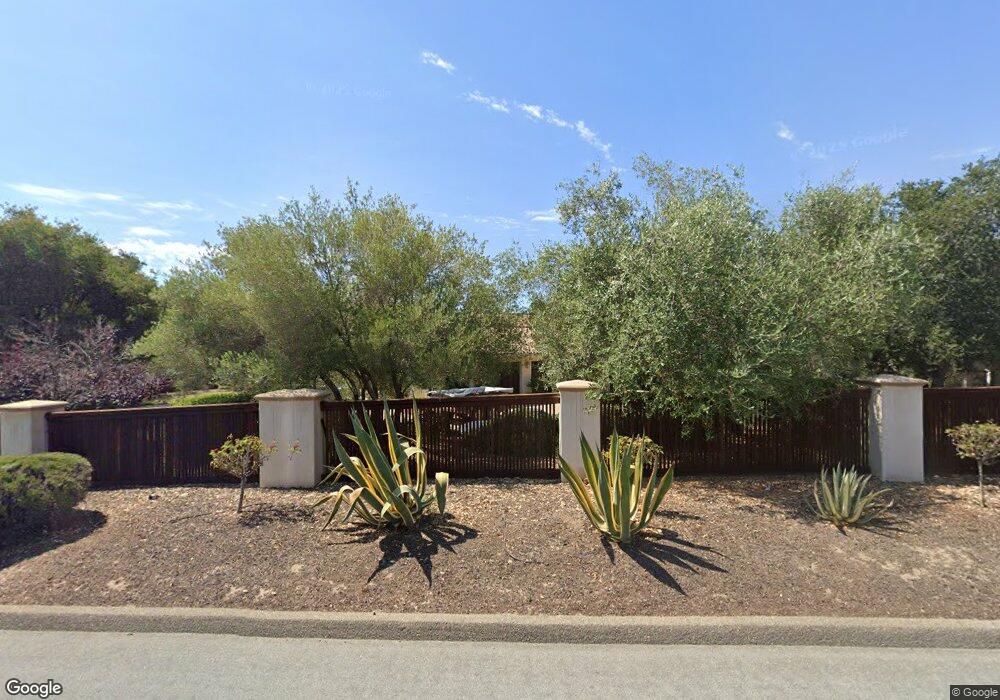
1050 Osage St Nipomo, CA 93444
Estimated Value: $1,703,000 - $1,838,000
5
Beds
6
Baths
4,606
Sq Ft
$384/Sq Ft
Est. Value
About This Home
This home is located at 1050 Osage St, Nipomo, CA 93444 and is currently estimated at $1,770,500, approximately $384 per square foot. 1050 Osage St is a home located in San Luis Obispo County with nearby schools including Dana Elementary School, Mesa Middle School, and Nipomo High School.
Ownership History
Date
Name
Owned For
Owner Type
Purchase Details
Closed on
Feb 9, 2024
Sold by
Nester Greg
Bought by
Nester Family Trust and Nester
Current Estimated Value
Purchase Details
Closed on
May 14, 2003
Sold by
Nester Greg
Bought by
Nester Greg
Home Financials for this Owner
Home Financials are based on the most recent Mortgage that was taken out on this home.
Original Mortgage
$320,000
Interest Rate
5.71%
Mortgage Type
Commercial
Create a Home Valuation Report for This Property
The Home Valuation Report is an in-depth analysis detailing your home's value as well as a comparison with similar homes in the area
Home Values in the Area
Average Home Value in this Area
Purchase History
| Date | Buyer | Sale Price | Title Company |
|---|---|---|---|
| Nester Family Trust | -- | None Listed On Document | |
| Nester Greg | -- | Fidelity Title Company |
Source: Public Records
Mortgage History
| Date | Status | Borrower | Loan Amount |
|---|---|---|---|
| Previous Owner | Nester Greg | $320,000 |
Source: Public Records
Tax History Compared to Growth
Tax History
| Year | Tax Paid | Tax Assessment Tax Assessment Total Assessment is a certain percentage of the fair market value that is determined by local assessors to be the total taxable value of land and additions on the property. | Land | Improvement |
|---|---|---|---|---|
| 2025 | $13,252 | $1,288,412 | $268,905 | $1,019,507 |
| 2024 | $13,101 | $1,263,150 | $263,633 | $999,517 |
| 2023 | $13,101 | $1,238,383 | $258,464 | $979,919 |
| 2022 | $12,903 | $1,214,102 | $253,397 | $960,705 |
| 2021 | $12,879 | $1,190,297 | $248,429 | $941,868 |
| 2020 | $12,732 | $1,178,093 | $245,882 | $932,211 |
| 2019 | $12,654 | $1,154,994 | $241,061 | $913,933 |
| 2018 | $12,503 | $1,132,348 | $236,335 | $896,013 |
| 2017 | $12,269 | $1,110,146 | $231,701 | $878,445 |
| 2016 | $11,572 | $1,088,379 | $227,158 | $861,221 |
| 2015 | $11,406 | $1,072,031 | $223,746 | $848,285 |
| 2014 | $10,983 | $1,051,033 | $219,364 | $831,669 |
Source: Public Records
Map
Nearby Homes
- 615 Sweet Donna Place
- 620 Camino Roble
- 7855 Suey Creek Rd
- 875 Camino Caballo
- 1010 1012 Upper Los Berros Rd
- 219 Lema Dr
- 217 Hope Way
- 759 Viola Ct
- 228 Chaparral Ln
- 261 Hazel Ln
- 255 Encino Ln
- 719 W Tefft St
- 680 Hill St
- Mesa Plan at Hill Street Terraces - Hill Street Series
- Pacific Plan at Hill Street Terraces - Hill Street Series
- Monarch Plan at Hill Street Terraces - Hill Street Series
- Rancho Plan at Hill Street Terraces - Hill Street Series
- Dana Plan at Hill Street Terraces - Hill Street Series
- 393 Uranus Ct
- 426 Polaris Dr
- 605 Sweet Donna Place
- 603 Sweet Donna Place
- 610 Sweet Donna Place
- 625 Sweet Donna Place
- 555 Camino Roble
- 509 Charro Way
- 515 Charro Way
- 625 Camino Roble
- 519 Charro Way
- 522 Charro Way
- 630 Sweet Donna Place
- 635 Sweet Donna Place
- 510 Tejas Place
- 560 Camino Roble
- 520 Tejas Place
- 484 Tejas Place
- 525 Charro Way
- 655 Camino Roble
- 530 Tejas Place
- 630 Camino Roble