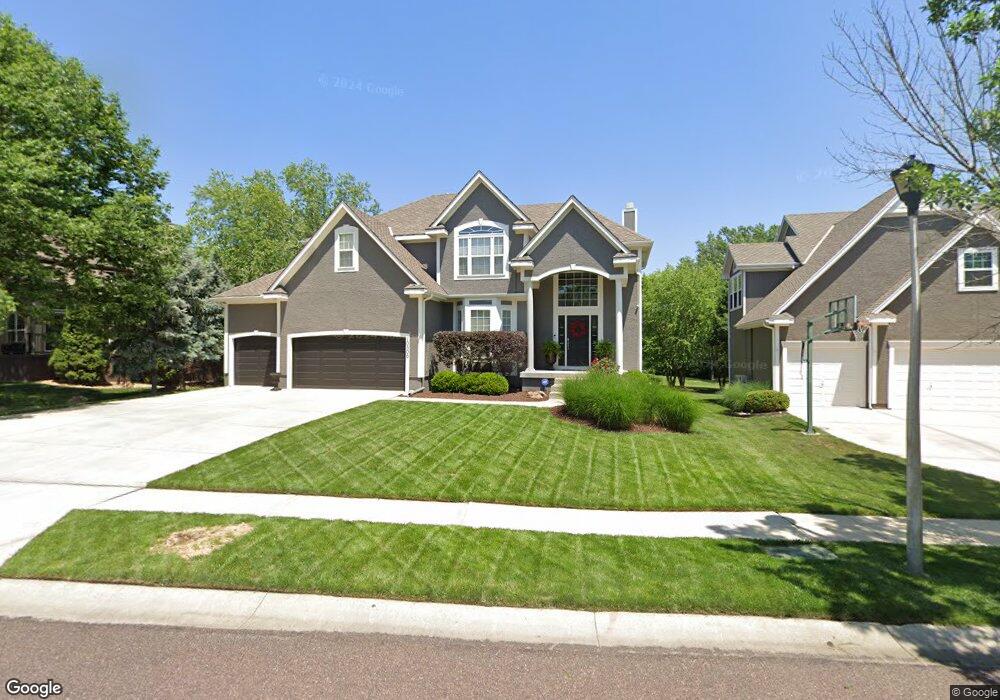
10506 W 144th Terrace Overland Park, KS 66221
South Overland Park NeighborhoodEstimated Value: $624,171 - $708,000
4
Beds
4
Baths
2,982
Sq Ft
$222/Sq Ft
Est. Value
About This Home
This home is located at 10506 W 144th Terrace, Overland Park, KS 66221 and is currently estimated at $663,043, approximately $222 per square foot. 10506 W 144th Terrace is a home located in Johnson County with nearby schools including Harmony Elementary School, Harmony Middle School, and Blue Valley Northwest High School.
Ownership History
Date
Name
Owned For
Owner Type
Purchase Details
Closed on
Mar 18, 2010
Sold by
Federal Home Loan Mortgage Corporation
Bought by
Berry Brent J and Berry Jennifer L
Current Estimated Value
Home Financials for this Owner
Home Financials are based on the most recent Mortgage that was taken out on this home.
Original Mortgage
$283,410
Outstanding Balance
$187,086
Interest Rate
4.9%
Mortgage Type
New Conventional
Estimated Equity
$475,957
Purchase Details
Closed on
Oct 28, 2009
Sold by
Seaberg Douglas Philip and Seaberg Tricia Joyner
Bought by
Federal Home Loan Mortgage Corp
Purchase Details
Closed on
Dec 17, 2004
Sold by
Cedarwood Homes Inc
Bought by
Seaberg Tricia J and Seaberg Douglas P
Home Financials for this Owner
Home Financials are based on the most recent Mortgage that was taken out on this home.
Original Mortgage
$77,008
Interest Rate
1.37%
Mortgage Type
Credit Line Revolving
Purchase Details
Closed on
Jul 26, 2003
Sold by
Brookwood Development Co Lc
Bought by
Cedarwood Homes Inc
Create a Home Valuation Report for This Property
The Home Valuation Report is an in-depth analysis detailing your home's value as well as a comparison with similar homes in the area
Home Values in the Area
Average Home Value in this Area
Purchase History
| Date | Buyer | Sale Price | Title Company |
|---|---|---|---|
| Berry Brent J | $314,900 | Servicelink | |
| Federal Home Loan Mortgage Corp | $326,775 | None Available | |
| Seaberg Tricia J | -- | None Available | |
| Cedarwood Homes Inc | -- | Security Land Title Company |
Source: Public Records
Mortgage History
| Date | Status | Borrower | Loan Amount |
|---|---|---|---|
| Open | Berry Brent J | $283,410 | |
| Previous Owner | Seaberg Tricia J | $77,008 |
Source: Public Records
Tax History Compared to Growth
Tax History
| Year | Tax Paid | Tax Assessment Tax Assessment Total Assessment is a certain percentage of the fair market value that is determined by local assessors to be the total taxable value of land and additions on the property. | Land | Improvement |
|---|---|---|---|---|
| 2024 | $5,615 | $65,780 | $14,139 | $51,641 |
| 2023 | $5,378 | $62,640 | $14,139 | $48,501 |
| 2022 | $5,849 | $55,108 | $14,139 | $40,969 |
| 2021 | $5,585 | $49,979 | $11,303 | $38,676 |
| 2020 | $5,522 | $49,082 | $9,821 | $39,261 |
| 2019 | $5,647 | $49,128 | $8,542 | $40,586 |
| 2018 | $5,438 | $46,368 | $8,542 | $37,826 |
| 2017 | $5,024 | $42,090 | $8,542 | $33,548 |
| 2016 | $4,789 | $40,100 | $8,542 | $31,558 |
| 2015 | $4,580 | $38,191 | $8,542 | $29,649 |
| 2013 | -- | $35,431 | $8,542 | $26,889 |
Source: Public Records
Map
Nearby Homes
- 14401 Stearns St
- 10675 W 142nd Terrace
- 14516 Reeder St
- 10708 W 142nd St
- 10612 W 141st St
- 14602 Grant Ln
- 14605 Carter St
- 10808 W 141st St
- 11110 W 146th Terrace
- 14308 Barton St
- 11130 W 146th Terrace
- The Santa Barbara Plan at Polo Fields
- The Laguna Plan at Polo Fields
- The Laguna 1.5 Story Plan at Polo Fields
- Windsor Plan at Chapel Hill
- Bristol Plan at Chapel Hill
- The Breckenridge Plan at Polo Fields
- 9309 W 144th Terrace
- 14066 Knox St
- 11308 W 143rd Terrace
- 10502 W 144th Terrace
- 14449 Goddard St
- 14453 Goddard St
- 10406 W 144th Terrace
- 14445 Goddard St
- 10507 W 144th Terrace
- 10503 W 144th Terrace
- 10603 W 144th Terrace
- 10402 W 144th Terrace
- 10607 W 144th Terrace
- 10403 W 144th Terrace
- 14452 Goddard St
- 14429 Melrose St
- 14456 Goddard St
- 14425 Melrose St
- 14424 Stearns St
- 14433 Melrose St
- 10302 W 144th Terrace
- 14421 Melrose St
- 10700 W 145th St