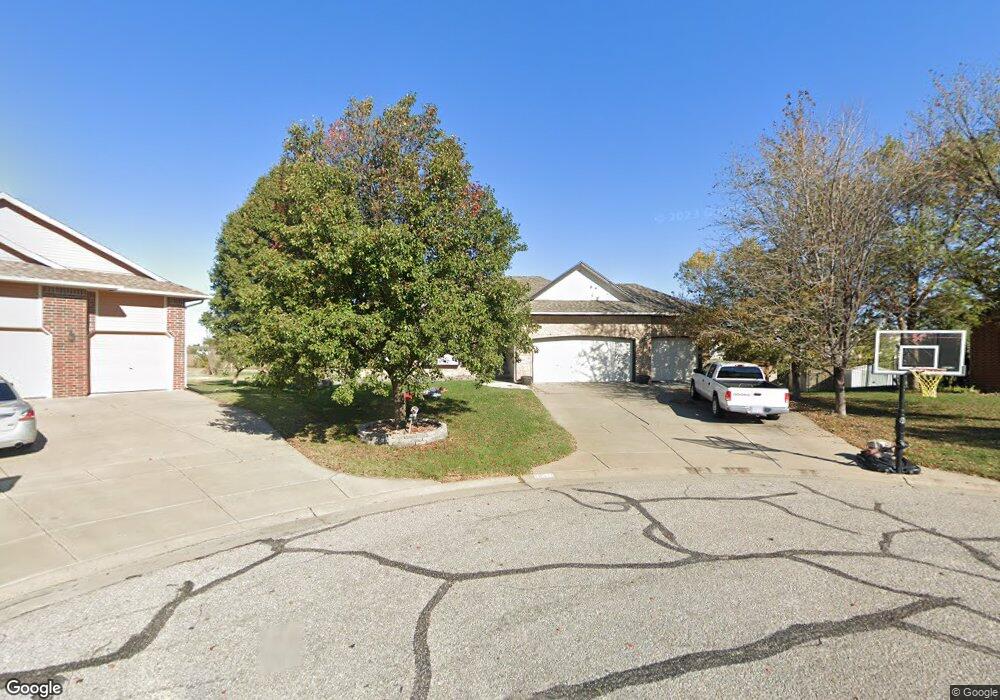
10514 E Mainsgate Ct Wichita, KS 67226
Northeast Wichita NeighborhoodEstimated Value: $324,000 - $342,033
4
Beds
3
Baths
2,855
Sq Ft
$117/Sq Ft
Est. Value
About This Home
This home is located at 10514 E Mainsgate Ct, Wichita, KS 67226 and is currently estimated at $333,017, approximately $116 per square foot. 10514 E Mainsgate Ct is a home located in Sedgwick County with nearby schools including Minneha Core Knowledge Elementary School, Coleman Environmental Magnet Middle School, and Wichita Southeast High School.
Ownership History
Date
Name
Owned For
Owner Type
Purchase Details
Closed on
Nov 23, 2015
Sold by
Nguyen Lynn T
Bought by
Phan Trung T
Current Estimated Value
Home Financials for this Owner
Home Financials are based on the most recent Mortgage that was taken out on this home.
Original Mortgage
$173,992
Outstanding Balance
$136,667
Interest Rate
3.75%
Mortgage Type
FHA
Estimated Equity
$196,350
Purchase Details
Closed on
Dec 4, 2007
Sold by
Primacy Closing Corp
Bought by
Nguyen Lynn T
Home Financials for this Owner
Home Financials are based on the most recent Mortgage that was taken out on this home.
Original Mortgage
$139,410
Interest Rate
6.11%
Mortgage Type
New Conventional
Purchase Details
Closed on
Aug 31, 2006
Sold by
Schauner Greg and Schauner Alma L
Bought by
Woodside Lara M and Woodside Richard
Home Financials for this Owner
Home Financials are based on the most recent Mortgage that was taken out on this home.
Original Mortgage
$35,999
Interest Rate
6.64%
Mortgage Type
Stand Alone Second
Create a Home Valuation Report for This Property
The Home Valuation Report is an in-depth analysis detailing your home's value as well as a comparison with similar homes in the area
Home Values in the Area
Average Home Value in this Area
Purchase History
| Date | Buyer | Sale Price | Title Company |
|---|---|---|---|
| Phan Trung T | -- | Land Title Inc | |
| Nguyen Lynn T | -- | None Available | |
| Woodside Lara M | -- | None Available |
Source: Public Records
Mortgage History
| Date | Status | Borrower | Loan Amount |
|---|---|---|---|
| Open | Phan Trung T | $173,992 | |
| Previous Owner | Nguyen Lynn T | $139,410 | |
| Previous Owner | Woodside Lara M | $35,999 | |
| Previous Owner | Woodside Lara M | $143,006 |
Source: Public Records
Tax History Compared to Growth
Tax History
| Year | Tax Paid | Tax Assessment Tax Assessment Total Assessment is a certain percentage of the fair market value that is determined by local assessors to be the total taxable value of land and additions on the property. | Land | Improvement |
|---|---|---|---|---|
| 2025 | $3,391 | $33,592 | $8,131 | $25,461 |
| 2023 | $3,391 | $31,108 | $6,567 | $24,541 |
| 2022 | $3,103 | $27,681 | $6,187 | $21,494 |
| 2021 | $2,929 | $25,392 | $3,887 | $21,505 |
| 2020 | $2,782 | $24,186 | $3,887 | $20,299 |
| 2019 | $2,551 | $22,172 | $3,887 | $18,285 |
| 2018 | $2,459 | $21,322 | $3,876 | $17,446 |
| 2017 | $2,385 | $0 | $0 | $0 |
| 2016 | $2,312 | $0 | $0 | $0 |
| 2015 | $3,137 | $0 | $0 | $0 |
| 2014 | $3,177 | $0 | $0 | $0 |
Source: Public Records
Map
Nearby Homes
- 2455 N Regency Lakes Ct
- 10231 E Windemere Ct
- 10227 E Windemere Ct
- 2507 N Cranbrook Ct
- 2323 N Stoneybrook Ct
- 2526 N Fox Run
- 9510 E Shannon Woods St
- 2530 N Greenleaf Ct
- 1906 N Frederic Cir
- 9400 E Wilson Estates Pkwy
- 2710 N Bracken Ct
- 12202 E Mainsgate St
- 1810 N Veranda St
- 2610 N Wilderness Cir
- 10611 E Summerfield Cir
- 8913 E Boxthorn St
- 12210 E Ayesbury Ct
- 12092 E Shadowridge St
- 12093 E Pepperwood St
- 12369 E Woodspring Ct
- 10510 E Mainsgate Ct
- 10518 E Mainsgate Ct
- 10506 E Mainsgate Ct
- 10522 E Mainsgate Ct
- 2516 N Brandon Cir
- 10502 E Mainsgate Ct
- 2520 N Brandon Cir
- 10604 E Mainsgate St
- 2512 N Brandon Cir
- 2508 N Brandon Cir
- 2524 N Brandon Cir
- 10519 E Mainsgate St
- 10519 E Mainsgate Rd
- 10608 E Mainsgate St
- 2504 N Brandon Cir
- 10507 E Mainsgate Rd
- 2517 N Brandon Cir
- 10609 E Mainsgate St
- 2525 N Brandon Cir
- 10511 E Mainsgate St