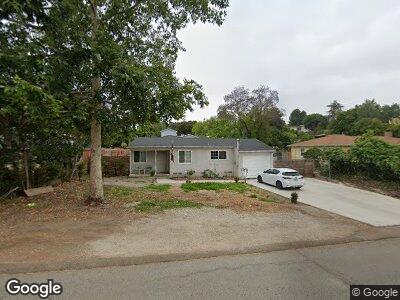
10515 Don Pico Rd Spring Valley, CA 91978
Estimated Value: $630,000 - $775,000
2
Beds
1
Bath
1,016
Sq Ft
$705/Sq Ft
Est. Value
About This Home
This home is located at 10515 Don Pico Rd, Spring Valley, CA 91978 and is currently estimated at $716,291, approximately $705 per square foot. 10515 Don Pico Rd is a home located in San Diego County with nearby schools including Loma Elementary School, Spring Valley Middle School, and Monte Vista High School.
Ownership History
Date
Name
Owned For
Owner Type
Purchase Details
Closed on
Sep 7, 2001
Sold by
Medina Angel D
Bought by
Dingle Eddie and Dingle Denise
Current Estimated Value
Home Financials for this Owner
Home Financials are based on the most recent Mortgage that was taken out on this home.
Original Mortgage
$167,200
Interest Rate
7.37%
Purchase Details
Closed on
Jun 13, 2000
Sold by
Brackett Family Trust 05-23-95 and Spencer Rimmel
Bought by
Medina Angel D
Home Financials for this Owner
Home Financials are based on the most recent Mortgage that was taken out on this home.
Original Mortgage
$127,950
Interest Rate
9.75%
Purchase Details
Closed on
Aug 28, 1995
Sold by
Brackett Lelia Louise
Bought by
Brackett Lelia L
Create a Home Valuation Report for This Property
The Home Valuation Report is an in-depth analysis detailing your home's value as well as a comparison with similar homes in the area
Home Values in the Area
Average Home Value in this Area
Purchase History
| Date | Buyer | Sale Price | Title Company |
|---|---|---|---|
| Dingle Eddie | $209,000 | First American Title | |
| Medina Angel D | $160,000 | Guardian Title Company | |
| Brackett Lelia L | -- | -- |
Source: Public Records
Mortgage History
| Date | Status | Borrower | Loan Amount |
|---|---|---|---|
| Open | Dingle Eddie | $304,000 | |
| Closed | Dingle Eddie | $253,300 | |
| Closed | Dingle Eddie | $51,007 | |
| Closed | Dingle Eddie | $32,850 | |
| Closed | Dingle Eddie | $21,538 | |
| Closed | Dingle Eddie | $282,500 | |
| Closed | Dingle Eddie | $95,000 | |
| Closed | Dingle Eddie | $167,200 | |
| Previous Owner | Medina Angel | $15,789 | |
| Previous Owner | Medina Angel | $7,012 | |
| Previous Owner | Medina Angel D | $127,950 | |
| Closed | Medina Angel D | $24,050 | |
| Closed | Dingle Eddie | $41,800 |
Source: Public Records
Tax History Compared to Growth
Tax History
| Year | Tax Paid | Tax Assessment Tax Assessment Total Assessment is a certain percentage of the fair market value that is determined by local assessors to be the total taxable value of land and additions on the property. | Land | Improvement |
|---|---|---|---|---|
| 2024 | $4,278 | $309,777 | $157,917 | $151,860 |
| 2023 | $4,142 | $303,704 | $154,821 | $148,883 |
| 2022 | $4,071 | $297,750 | $151,786 | $145,964 |
| 2021 | $4,028 | $291,912 | $148,810 | $143,102 |
| 2020 | $3,862 | $288,920 | $147,285 | $141,635 |
| 2019 | $3,801 | $283,256 | $144,398 | $138,858 |
| 2018 | $3,683 | $277,703 | $141,567 | $136,136 |
| 2017 | $832 | $272,259 | $138,792 | $133,467 |
| 2016 | $3,457 | $266,921 | $136,071 | $130,850 |
| 2015 | $3,436 | $262,913 | $134,028 | $128,885 |
| 2014 | $3,375 | $257,764 | $131,403 | $126,361 |
Source: Public Records
Map
Nearby Homes
- 10411 San Carlos Dr
- 10420 Loma Rancho Dr
- 10229 Del Rio Rd
- 3669 Calavo Dr
- 11231 Del Rio Rd
- 0 Calle Los Arboles Unit AR25020982
- 0 Calle Los Arboles
- 10952 Avenida Roberta
- 10477 Pine Grove St
- 2916 Alanwood Ct
- 2920 Alanwood Ct
- 3059 Brookpine Ct
- 10171 Ramona Dr
- 2967 Shady Pine St
- 3646 Avocado Village Ct Unit 74
- 3645 Avocado Village Ct Unit 104
- 3669 Avocado Village Ct Unit 173
- 2963 Alwood Ct Unit 1
- 11035 Via Merida
- 3952 Agua Dulce Blvd
- 10515 Don Pico Rd
- 10521 Don Pico Rd
- 10507 Don Pico Rd
- 10520 San Carlos Dr
- 10529 Don Pico Rd
- 10528 San Carlos Dr
- 10459 Don Pico Rd
- 10514 San Carlos Dr
- 10510 Don Pico Rd
- 3472 Calavo Dr
- 10520 Don Pico Rd
- 10526 Don Pico Rd
- 10500 Don Pico Rd Unit 2
- 10537 Don Pico Rd
- 10510 San Carlos Dr
- 10455 Don Pico Rd
- 10534 Don Pico Rd
- 10454 San Carlos Dr
- 10452 Don Pico Rd
- 10433 Don Pico Rd