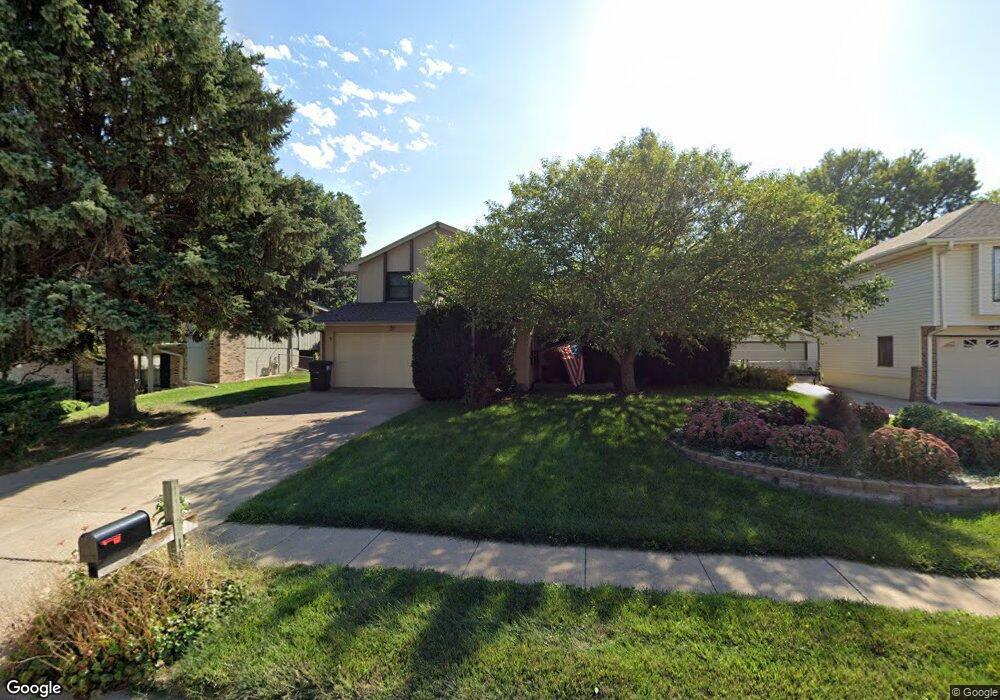
10517 V St Omaha, NE 68127
Oak Heights NeighborhoodEstimated Value: $320,000 - $364,000
3
Beds
3
Baths
2,472
Sq Ft
$135/Sq Ft
Est. Value
About This Home
This home is located at 10517 V St, Omaha, NE 68127 and is currently estimated at $333,571, approximately $134 per square foot. 10517 V St is a home located in Douglas County with nearby schools including Hitchcock Elementary School, Millard South High School, and Millard Central Middle School.
Ownership History
Date
Name
Owned For
Owner Type
Purchase Details
Closed on
May 1, 2024
Sold by
Ruby J Peterson Living Trust and Peterson Kent W
Bought by
Warren B Peterson Living Trust and Peterson
Current Estimated Value
Purchase Details
Closed on
Sep 25, 2015
Sold by
Peterson Ruby J and Peterson Warren B
Bought by
Ruby J Peterson Living Trust and Peterson Warren B
Purchase Details
Closed on
Sep 23, 2015
Sold by
Peterson Warren B and Peterson Ruby J
Bought by
Peterson Ruby J
Create a Home Valuation Report for This Property
The Home Valuation Report is an in-depth analysis detailing your home's value as well as a comparison with similar homes in the area
Home Values in the Area
Average Home Value in this Area
Purchase History
| Date | Buyer | Sale Price | Title Company |
|---|---|---|---|
| Warren B Peterson Living Trust | -- | None Listed On Document | |
| Ruby J Peterson Living Trust | -- | None Available | |
| Peterson Ruby J | -- | None Available | |
| Peterson Warren B | -- | None Available |
Source: Public Records
Tax History Compared to Growth
Tax History
| Year | Tax Paid | Tax Assessment Tax Assessment Total Assessment is a certain percentage of the fair market value that is determined by local assessors to be the total taxable value of land and additions on the property. | Land | Improvement |
|---|---|---|---|---|
| 2025 | $5,154 | $309,100 | $33,500 | $275,600 |
| 2024 | $5,700 | $309,100 | $33,500 | $275,600 |
| 2023 | $5,700 | $286,300 | $33,500 | $252,800 |
| 2022 | $5,409 | $255,900 | $33,500 | $222,400 |
| 2021 | $4,685 | $222,800 | $33,500 | $189,300 |
| 2020 | $4,232 | $199,600 | $33,500 | $166,100 |
| 2019 | $4,245 | $199,600 | $33,500 | $166,100 |
| 2018 | $3,933 | $182,400 | $33,500 | $148,900 |
| 2017 | $3,583 | $168,800 | $33,500 | $135,300 |
| 2016 | $3,803 | $179,000 | $22,500 | $156,500 |
| 2015 | $3,628 | $167,300 | $21,000 | $146,300 |
| 2014 | $3,628 | $167,300 | $21,000 | $146,300 |
Source: Public Records
Map
Nearby Homes