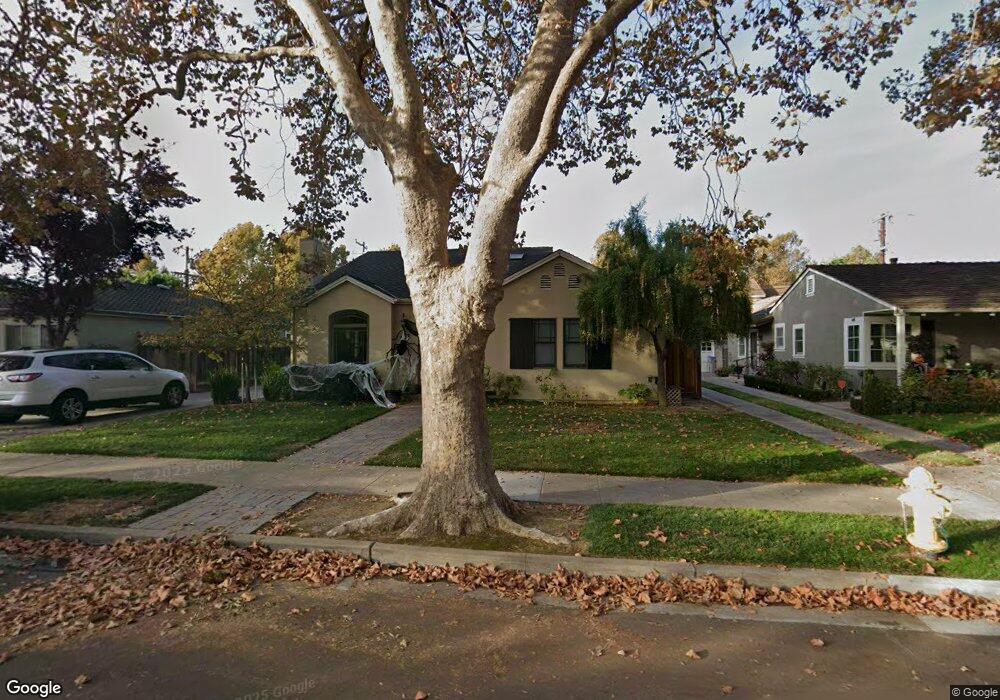
1053 Camino Ramon San Jose, CA 95125
Willow Glen NeighborhoodEstimated Value: $2,261,000 - $2,509,000
3
Beds
2
Baths
1,950
Sq Ft
$1,218/Sq Ft
Est. Value
About This Home
This home is located at 1053 Camino Ramon, San Jose, CA 95125 and is currently estimated at $2,374,283, approximately $1,217 per square foot. 1053 Camino Ramon is a home located in Santa Clara County with nearby schools including Willow Glen Elementary, Willow Glen Middle, and Willow Glen High School.
Ownership History
Date
Name
Owned For
Owner Type
Purchase Details
Closed on
Sep 19, 2002
Sold by
Borras Danielle Elizabeth
Bought by
Borras Laurence D
Current Estimated Value
Home Financials for this Owner
Home Financials are based on the most recent Mortgage that was taken out on this home.
Original Mortgage
$300,000
Outstanding Balance
$124,588
Interest Rate
6.16%
Estimated Equity
$2,249,695
Purchase Details
Closed on
Jan 4, 2002
Sold by
Borras Laurence D
Bought by
Borras Laurence D and Borras Danielle Elizabeth
Home Financials for this Owner
Home Financials are based on the most recent Mortgage that was taken out on this home.
Original Mortgage
$285,000
Interest Rate
7.01%
Purchase Details
Closed on
Dec 9, 1993
Sold by
Feasby Thomas J and Feasby Janette G
Bought by
Borras Laurence D
Home Financials for this Owner
Home Financials are based on the most recent Mortgage that was taken out on this home.
Original Mortgage
$245,000
Interest Rate
7.09%
Create a Home Valuation Report for This Property
The Home Valuation Report is an in-depth analysis detailing your home's value as well as a comparison with similar homes in the area
Home Values in the Area
Average Home Value in this Area
Purchase History
| Date | Buyer | Sale Price | Title Company |
|---|---|---|---|
| Borras Laurence D | -- | Financial Title Company | |
| Borras Laurence D | -- | Old Republic Title Company | |
| Borras Laurence D | $316,000 | Stewart Title Of California |
Source: Public Records
Mortgage History
| Date | Status | Borrower | Loan Amount |
|---|---|---|---|
| Open | Borras Laurence D | $300,000 | |
| Closed | Borras Laurence D | $285,000 | |
| Closed | Borras Laurence D | $245,000 |
Source: Public Records
Tax History Compared to Growth
Tax History
| Year | Tax Paid | Tax Assessment Tax Assessment Total Assessment is a certain percentage of the fair market value that is determined by local assessors to be the total taxable value of land and additions on the property. | Land | Improvement |
|---|---|---|---|---|
| 2025 | $8,945 | $661,088 | $268,535 | $392,553 |
| 2024 | $8,945 | $648,126 | $263,270 | $384,856 |
| 2023 | $8,758 | $635,418 | $258,108 | $377,310 |
| 2022 | $8,682 | $622,960 | $253,048 | $369,912 |
| 2021 | $8,482 | $610,746 | $248,087 | $362,659 |
| 2020 | $8,273 | $604,485 | $245,544 | $358,941 |
| 2019 | $8,086 | $592,633 | $240,730 | $351,903 |
| 2018 | $7,997 | $581,013 | $236,010 | $345,003 |
| 2017 | $7,926 | $569,622 | $231,383 | $338,239 |
| 2016 | $7,755 | $558,454 | $226,847 | $331,607 |
| 2015 | $7,698 | $550,066 | $223,440 | $326,626 |
| 2014 | $7,253 | $539,292 | $219,064 | $320,228 |
Source: Public Records
Map
Nearby Homes
- 1013 Camino Pablo
- 1197 Willow St
- 108 Glen Eyrie Ave
- 1192 Crescent Dr
- 1321 Fruitdale Ave
- 1133 Garfield Ave
- 1232 Coolidge Ave
- 1503 Willowhaven Ct
- 1307 Pedro St
- 1044 Lincoln Ave
- 960 Lakeshire Ct
- 1114 Vanessa Dr
- 1344 Iris Ct
- 1485 De Rose Way Unit 123
- 1133 Cooper River Dr Unit 42
- 1668 Dolores Dr
- 1494 Meridian Ave
- 1265 Blewett Ave
- 1785 Santa Barbara Dr
- 935 Chabrant Way
- 1047 Camino Ramon
- 1059 Camino Ramon
- 1054 Glen Brook Ave
- 1046 Glen Brook Ave
- 1041 Camino Ramon
- 1065 Camino Ramon
- 1062 Glen Brook Ave
- 1054 Camino Ramon
- 1060 Camino Ramon
- 1038 Glen Brook Ave
- 1070 Glen Brook Ave
- 1048 Camino Ramon
- 1071 Camino Ramon
- 1035 Camino Ramon
- 1066 Camino Ramon
- 1042 Camino Ramon
- 1030 Glen Brook Ave
- 1072 Camino Ramon
- 1078 Glen Brook Ave
- 1077 Camino Ramon