1054 Lost Valley Ct Chula Vista, CA 91913
Otay Ranch Village NeighborhoodEstimated Value: $966,875 - $1,051,000
5
Beds
3
Baths
2,148
Sq Ft
$470/Sq Ft
Est. Value
About This Home
This home is located at 1054 Lost Valley Ct, Chula Vista, CA 91913 and is currently estimated at $1,010,469, approximately $470 per square foot. 1054 Lost Valley Ct is a home located in San Diego County with nearby schools including Corky McMillin Elementary School, Rancho Del Rey Middle School, and Olympian High School.
Ownership History
Date
Name
Owned For
Owner Type
Purchase Details
Closed on
Oct 19, 2005
Sold by
Reyes Genciano G
Bought by
Reyes Genciano and Reyes Elsie Fernando
Current Estimated Value
Home Financials for this Owner
Home Financials are based on the most recent Mortgage that was taken out on this home.
Original Mortgage
$597,550
Outstanding Balance
$221,129
Interest Rate
1%
Mortgage Type
Negative Amortization
Estimated Equity
$789,340
Purchase Details
Closed on
Aug 26, 2002
Sold by
Reyes Genciano Guevarra and Reyes Elsie Fernando
Bought by
Reyes Genciano and Reyes Elsie Fernando
Home Financials for this Owner
Home Financials are based on the most recent Mortgage that was taken out on this home.
Original Mortgage
$284,000
Interest Rate
6.29%
Mortgage Type
Balloon
Purchase Details
Closed on
May 3, 2001
Sold by
Otay Ranch V 2 Llc
Bought by
Reyes Genciano Guevara and Reyes Elsie Fernando
Home Financials for this Owner
Home Financials are based on the most recent Mortgage that was taken out on this home.
Original Mortgage
$240,000
Interest Rate
7.09%
Create a Home Valuation Report for This Property
The Home Valuation Report is an in-depth analysis detailing your home's value as well as a comparison with similar homes in the area
Home Values in the Area
Average Home Value in this Area
Purchase History
| Date | Buyer | Sale Price | Title Company |
|---|---|---|---|
| Reyes Genciano | -- | -- | |
| Reyes Genciano G | -- | Southland Title Of San Diego | |
| Reyes Genciano | -- | Commonwealth Land Title | |
| Reyes Genciano Guevara | $300,000 | Commonwealth Land Title Co |
Source: Public Records
Mortgage History
| Date | Status | Borrower | Loan Amount |
|---|---|---|---|
| Open | Reyes Genciano G | $597,550 | |
| Closed | Reyes Genciano | $284,000 | |
| Previous Owner | Reyes Genciano Guevara | $240,000 | |
| Closed | Reyes Genciano Guevara | $45,000 | |
| Closed | Reyes Genciano | $53,200 |
Source: Public Records
Tax History Compared to Growth
Tax History
| Year | Tax Paid | Tax Assessment Tax Assessment Total Assessment is a certain percentage of the fair market value that is determined by local assessors to be the total taxable value of land and additions on the property. | Land | Improvement |
|---|---|---|---|---|
| 2025 | $8,105 | $443,167 | $169,878 | $273,289 |
| 2024 | $8,105 | $434,479 | $166,548 | $267,931 |
| 2023 | $7,971 | $425,961 | $163,283 | $262,678 |
| 2022 | $7,758 | $417,610 | $160,082 | $257,528 |
| 2021 | $7,617 | $409,423 | $156,944 | $252,479 |
| 2020 | $7,457 | $405,226 | $155,335 | $249,891 |
| 2019 | $7,286 | $397,282 | $152,290 | $244,992 |
| 2018 | $7,168 | $389,493 | $149,304 | $240,189 |
| 2017 | $7,039 | $381,857 | $146,377 | $235,480 |
| 2016 | $6,808 | $374,370 | $143,507 | $230,863 |
| 2015 | $6,645 | $368,748 | $141,352 | $227,396 |
| 2014 | -- | $361,526 | $138,584 | $222,942 |
Source: Public Records
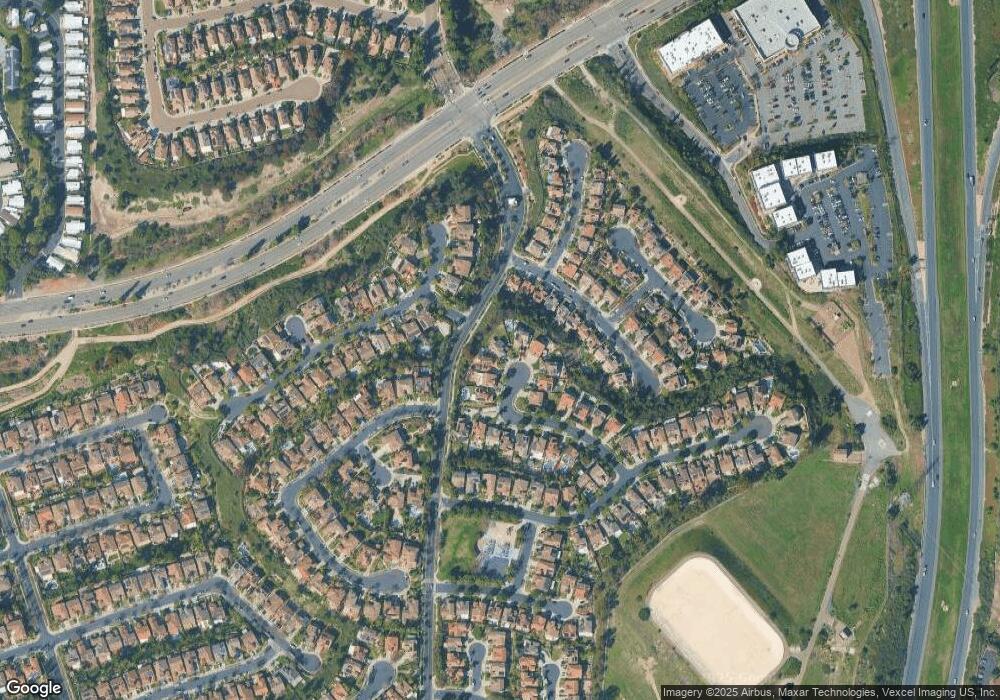
Map
Nearby Homes
- 1054 Forest Hill Place
- 1908 Petaluma Dr
- 1925 Otay Lakes Rd Unit 39
- 1925 Otay Lakes Rd Unit 69
- 1925 Otay Lakes Rd Unit 43
- 1925 Otay Lakes Rd Unit 167
- 1930 Parker Mountain Rd
- 845 Ridgewater Dr
- 1306 Mill Valley Rd
- 1279 Fools Gold Way Unit 2
- 1280 Haglar Way Unit 2
- 1873 Fargo Ln Unit 4
- 1020 Baywood Cir Unit E
- 2083 Lakeridge Cir Unit 104
- 1285 Fools Gold Way Unit 2
- 1295 Haglar Way Unit 1
- 1761 Harvard St
- 761 Brookstone Rd Unit 203
- 773 Brookstone Rd Unit 304
- 731 Brookstone Rd Unit 103
- 1050 Lost Valley Ct
- 1058 Lost Valley Ct
- 1062 Lost Valley Ct
- 1051 Lost Valley Ct
- 1066 Lost Valley Ct
- 1028 Grass Valley Rd
- 1055 Lost Valley Ct
- 1024 Grass Valley Rd
- 1032 Grass Valley Rd
- 1059 Lost Valley Ct
- 1036 Grass Valley Rd
- 1020 Grass Valley Rd Unit 1
- 1065 Lost Valley Ct
- 1998 Moss Landing Ave
- 1040 Grass Valley Rd
- 2000 Moss Landing Ave
- 1044 Grass Valley Rd
- 1994 Moss Landing Ave
- 1048 Grass Valley Rd
- 2004 Moss Landing Ave