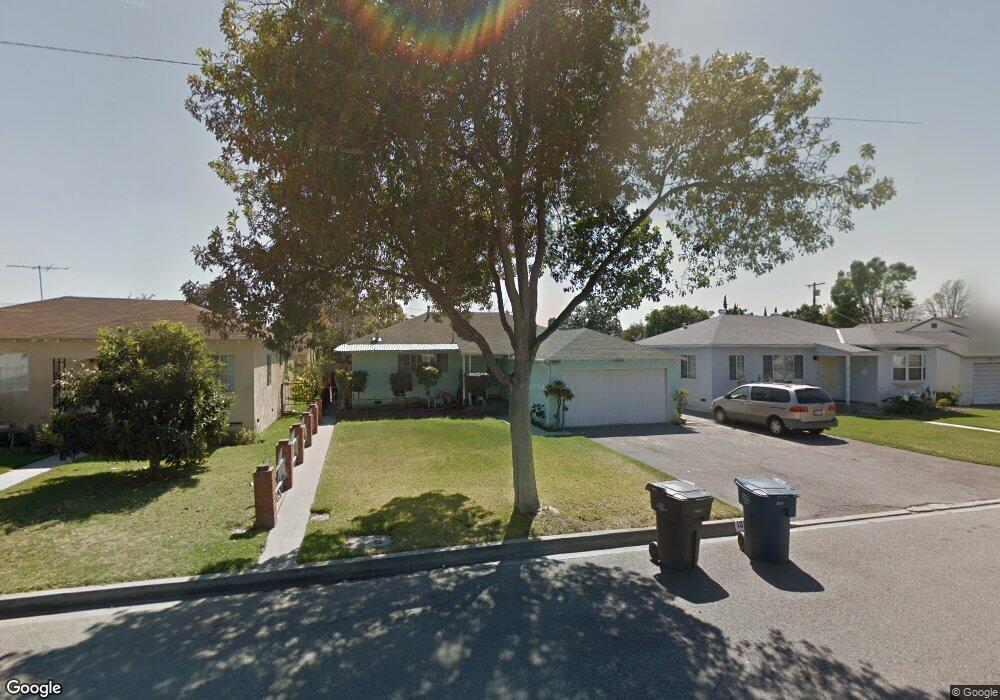
10540 Emery St El Monte, CA 91731
Northwest El Monte NeighborhoodEstimated Value: $810,000 - $889,000
3
Beds
2
Baths
1,260
Sq Ft
$682/Sq Ft
Est. Value
About This Home
This home is located at 10540 Emery St, El Monte, CA 91731 and is currently estimated at $859,405, approximately $682 per square foot. 10540 Emery St is a home located in Los Angeles County with nearby schools including Rio Vista Elementary School, Gidley Elementary School, and Arroyo High School.
Ownership History
Date
Name
Owned For
Owner Type
Purchase Details
Closed on
Sep 30, 2009
Sold by
Ma Erik and Ma Qing Guo
Bought by
Ma Erik
Current Estimated Value
Purchase Details
Closed on
May 2, 2005
Sold by
Chu Duc L and Chu Hoa M
Bought by
Ma Qing Guo
Purchase Details
Closed on
Oct 1, 2001
Sold by
Ma Minh Quoc and Ma Hoa Yen
Bought by
Chu Duc L
Home Financials for this Owner
Home Financials are based on the most recent Mortgage that was taken out on this home.
Original Mortgage
$138,000
Interest Rate
6.91%
Purchase Details
Closed on
Aug 22, 1994
Sold by
Yamamoto Joji and Yamamoto Masako
Bought by
Ma Minh Quoc
Home Financials for this Owner
Home Financials are based on the most recent Mortgage that was taken out on this home.
Original Mortgage
$141,300
Interest Rate
8.8%
Purchase Details
Closed on
Jul 8, 1994
Sold by
Chu Duc Ly
Bought by
Ma Hoa Yen
Home Financials for this Owner
Home Financials are based on the most recent Mortgage that was taken out on this home.
Original Mortgage
$141,300
Interest Rate
8.8%
Create a Home Valuation Report for This Property
The Home Valuation Report is an in-depth analysis detailing your home's value as well as a comparison with similar homes in the area
Home Values in the Area
Average Home Value in this Area
Purchase History
| Date | Buyer | Sale Price | Title Company |
|---|---|---|---|
| Ma Erik | -- | Accommodation | |
| Sam Van My | -- | Accommodation | |
| Ma Qing Guo | -- | -- | |
| Chu Duc L | -- | South Coast Title | |
| Ma Minh Quoc | $157,000 | Title Land Company Inc | |
| Ma Hoa Yen | -- | Title Land Company Inc |
Source: Public Records
Mortgage History
| Date | Status | Borrower | Loan Amount |
|---|---|---|---|
| Previous Owner | Chu Duc L | $138,000 | |
| Previous Owner | Ma Minh Quoc | $141,300 |
Source: Public Records
Tax History Compared to Growth
Tax History
| Year | Tax Paid | Tax Assessment Tax Assessment Total Assessment is a certain percentage of the fair market value that is determined by local assessors to be the total taxable value of land and additions on the property. | Land | Improvement |
|---|---|---|---|---|
| 2025 | $7,653 | $564,520 | $446,046 | $118,474 |
| 2024 | $7,653 | $553,451 | $437,300 | $116,151 |
| 2023 | $7,561 | $542,600 | $428,726 | $113,874 |
| 2022 | $7,226 | $531,962 | $420,320 | $111,642 |
| 2021 | $7,329 | $521,532 | $412,079 | $109,453 |
| 2019 | $7,367 | $506,064 | $399,857 | $106,207 |
| 2018 | $7,244 | $496,142 | $392,017 | $104,125 |
| 2016 | $6,945 | $476,879 | $376,796 | $100,083 |
| 2015 | $6,508 | $444,000 | $351,000 | $93,000 |
| 2014 | $6,106 | $425,000 | $335,800 | $89,200 |
Source: Public Records
Map
Nearby Homes
- 4552 Shasta Place
- 4660 Whitney Dr
- 4939 Doreen Ave
- 4911 Glickman Ave
- 4946 El Monte Ave
- 5140 Arden Dr
- 10018 La Rosa Dr
- 5240 Hallowell Ave
- 4800 Daleview Ave Unit 86
- 4800 Daleview Ave Unit 157
- 5109 Baldwin Ave
- 5305 Glickman Ave
- 11459 Poppy Ln
- 3951 Arden Dr
- 5340 Village Circle Dr
- 5138 Daleview Ave
- 4437 Ellis Ln
- 4439 Ellis Ln
- 4346 Cypress Ave
- 10904 Freer St
- 10534 Emery St
- 10544 Emery St
- 10528 Emery St
- 10548 Emery St
- 10543 Haverly St
- 10547 Haverly St
- 10537 Haverly St
- 10553 Haverly St
- 10524 Emery St
- 10554 Emery St
- 10533 Haverly St
- 10543 Emery St
- 10537 Emery St
- 10557 Haverly St
- 10547 Emery St
- 10533 Emery St
- 10527 Haverly St
- 10520 Emery St
- 10558 Emery St
- 10553 Emery St