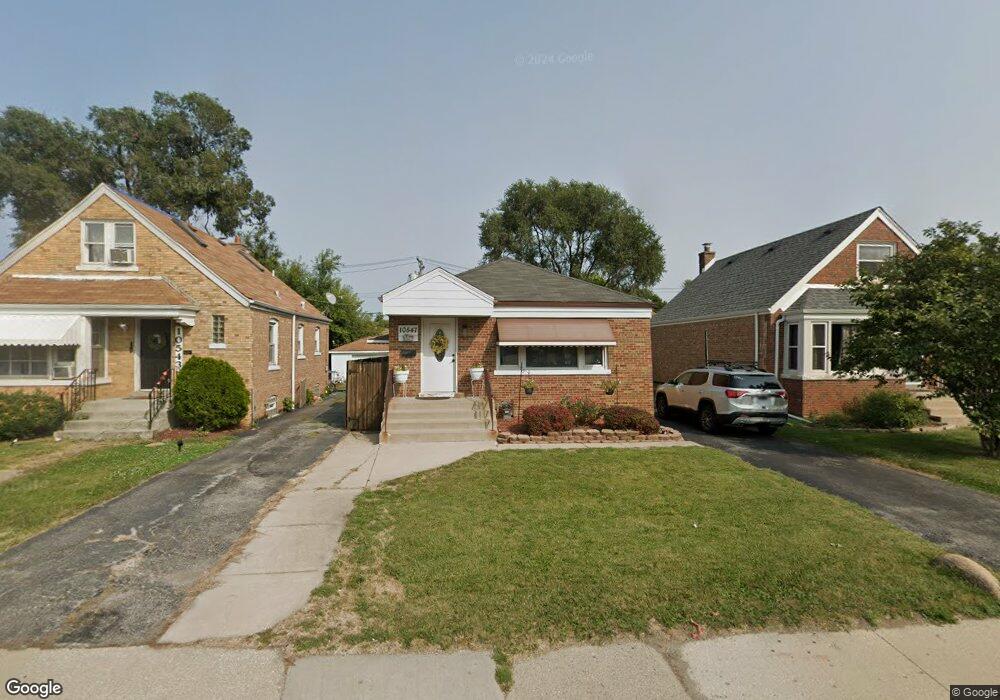
10547 S Pulaski Rd Chicago, IL 60655
Mount Greenwood NeighborhoodEstimated Value: $273,000 - $294,000
3
Beds
2
Baths
864
Sq Ft
$324/Sq Ft
Est. Value
About This Home
This home is located at 10547 S Pulaski Rd, Chicago, IL 60655 and is currently estimated at $279,857, approximately $323 per square foot. 10547 S Pulaski Rd is a home located in Cook County with nearby schools including Mount Greenwood Elementary School, Morgan Park High School, and St Catherine Of Alexandria School.
Ownership History
Date
Name
Owned For
Owner Type
Purchase Details
Closed on
Sep 6, 2007
Sold by
Rooney Michael P
Bought by
Diver Robert B and Diver Randa R
Current Estimated Value
Home Financials for this Owner
Home Financials are based on the most recent Mortgage that was taken out on this home.
Original Mortgage
$196,000
Outstanding Balance
$124,981
Interest Rate
6.71%
Mortgage Type
Unknown
Estimated Equity
$154,876
Purchase Details
Closed on
Apr 11, 2006
Sold by
Fitzgerald Scott
Bought by
Rooney Michael P
Purchase Details
Closed on
Mar 28, 2006
Sold by
Dworzycki Jacqueline V and Fitzgerald Matthew S
Bought by
Rooney Michael P
Purchase Details
Closed on
Apr 20, 1994
Sold by
Swider Krzystztof and Swider Donna M
Bought by
Fitzgerald Thomas
Home Financials for this Owner
Home Financials are based on the most recent Mortgage that was taken out on this home.
Original Mortgage
$67,000
Interest Rate
7.66%
Create a Home Valuation Report for This Property
The Home Valuation Report is an in-depth analysis detailing your home's value as well as a comparison with similar homes in the area
Home Values in the Area
Average Home Value in this Area
Purchase History
| Date | Buyer | Sale Price | Title Company |
|---|---|---|---|
| Diver Robert B | $196,000 | Chicago Title Insurance Co | |
| Rooney Michael P | -- | None Available | |
| Rooney Michael P | -- | None Available | |
| Fitzgerald Thomas | $33,333 | -- |
Source: Public Records
Mortgage History
| Date | Status | Borrower | Loan Amount |
|---|---|---|---|
| Open | Diver Robert B | $196,000 | |
| Previous Owner | Fitzgerald Thomas | $67,000 |
Source: Public Records
Tax History Compared to Growth
Tax History
| Year | Tax Paid | Tax Assessment Tax Assessment Total Assessment is a certain percentage of the fair market value that is determined by local assessors to be the total taxable value of land and additions on the property. | Land | Improvement |
|---|---|---|---|---|
| 2024 | $2,966 | $23,001 | $5,828 | $17,173 |
| 2023 | $3,008 | $18,000 | $4,662 | $13,338 |
| 2022 | $3,008 | $18,000 | $4,662 | $13,338 |
| 2021 | $2,958 | $18,000 | $4,662 | $13,338 |
| 2020 | $3,575 | $19,113 | $4,428 | $14,685 |
| 2019 | $3,494 | $20,775 | $4,428 | $16,347 |
| 2018 | $3,434 | $20,775 | $4,428 | $16,347 |
| 2017 | $3,405 | $19,160 | $3,962 | $15,198 |
| 2016 | $3,345 | $19,160 | $3,962 | $15,198 |
| 2015 | $3,238 | $20,249 | $3,962 | $16,287 |
| 2014 | $2,877 | $18,037 | $3,729 | $14,308 |
| 2013 | $2,809 | $18,037 | $3,729 | $14,308 |
Source: Public Records
Map
Nearby Homes
- 4000 W 107th St
- 10448 S Pulaski Rd
- 10418 S Pulaski Rd Unit 204C
- 3818 W 107th St
- 10509 Kedvale Ave
- 10511 S Hamlin Ave
- 10728 S Pulaski Rd
- 10606 S Ridgeway Ave
- 3857 W 107th Place
- 10528 S Lawndale Ave
- 10314 S Komensky Ave Unit 3C
- 10823 S Keeler Ave
- 10420 S Kildare Ave
- 3835 W 109th Place
- 10126 S Pulaski Rd Unit P4
- 4232 W 109th St
- 10110 S Pulaski Rd Unit 3W
- 10100 S Pulaski Rd Unit 1E
- 3534 W 103rd St
- 10048 S Pulaski Rd Unit 2B
- 10543 S Pulaski Rd
- 10551 S Pulaski Rd
- 10555 S Pulaski Rd
- 10539 S Pulaski Rd
- 10559 S Pulaski Rd
- 10535 S Pulaski Rd
- 10546 S Harding Ave
- 10542 S Harding Ave
- 10550 S Harding Ave
- 10531 S Pulaski Rd
- 10538 S Harding Ave
- 10554 S Harding Ave
- 10558 S Harding Ave
- 10534 S Harding Ave
- 4001 W 105th Place
- 10527 S Pulaski Rd
- 10530 S Harding Ave
- 10523 S Pulaski Rd
- 10526 S Harding Ave
- 10550 S Pulaski Rd