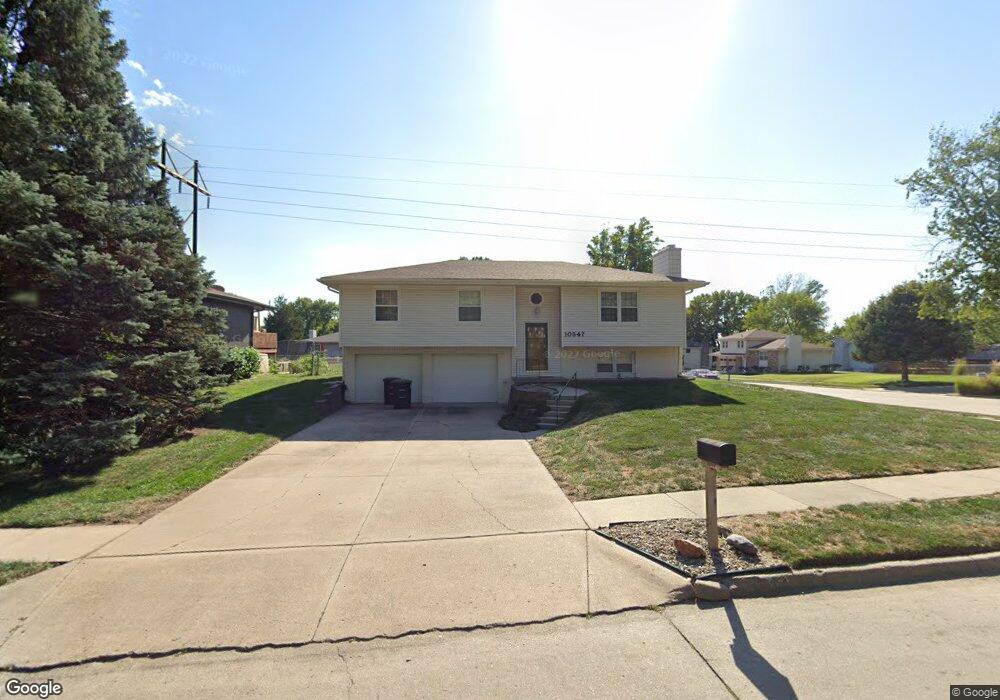
10547 U St Omaha, NE 68127
Oak Heights NeighborhoodEstimated Value: $264,000 - $283,000
3
Beds
3
Baths
1,276
Sq Ft
$214/Sq Ft
Est. Value
About This Home
This home is located at 10547 U St, Omaha, NE 68127 and is currently estimated at $272,957, approximately $213 per square foot. 10547 U St is a home located in Douglas County with nearby schools including Hitchcock Elementary School, Millard South High School, and Millard Central Middle School.
Ownership History
Date
Name
Owned For
Owner Type
Purchase Details
Closed on
Aug 28, 2023
Sold by
Mcmillan Marlene Mitzi
Bought by
Ramirez Juan Enrique Sanc and Aguilar Nancy Torres
Current Estimated Value
Home Financials for this Owner
Home Financials are based on the most recent Mortgage that was taken out on this home.
Original Mortgage
$250,381
Outstanding Balance
$244,644
Interest Rate
6.78%
Mortgage Type
FHA
Estimated Equity
$28,313
Create a Home Valuation Report for This Property
The Home Valuation Report is an in-depth analysis detailing your home's value as well as a comparison with similar homes in the area
Home Values in the Area
Average Home Value in this Area
Purchase History
| Date | Buyer | Sale Price | Title Company |
|---|---|---|---|
| Ramirez Juan Enrique Sanc | -- | None Listed On Document |
Source: Public Records
Mortgage History
| Date | Status | Borrower | Loan Amount |
|---|---|---|---|
| Open | Ramirez Juan Enrique Sanc | $250,381 |
Source: Public Records
Tax History
| Year | Tax Paid | Tax Assessment Tax Assessment Total Assessment is a certain percentage of the fair market value that is determined by local assessors to be the total taxable value of land and additions on the property. | Land | Improvement |
|---|---|---|---|---|
| 2025 | $4,056 | $242,000 | $39,400 | $202,600 |
| 2024 | -- | $242,000 | $39,400 | $202,600 |
| 2023 | -- | $216,400 | $39,400 | $177,000 |
| 2022 | $0 | $184,700 | $39,400 | $145,300 |
| 2021 | $0 | $163,100 | $39,400 | $123,700 |
| 2020 | $0 | $152,200 | $39,400 | $112,800 |
| 2019 | $0 | $152,200 | $39,400 | $112,800 |
| 2018 | $0 | $140,200 | $39,400 | $100,800 |
| 2017 | $0 | $126,200 | $39,400 | $86,800 |
| 2016 | $0 | $128,300 | $22,500 | $105,800 |
Source: Public Records
Map
Nearby Homes
- 5330 S 105th St
- 5505 S 104th Ave
- 10804 Borman Ave
- 5511 S 104th Cir
- 10212 V St
- 11009 U St
- 11106 V St
- 6217 S 109th St
- 10527 M St
- 4948 S 98th Avenue Cir
- 6509 S 108th Ave
- 11316 Y St
- 11324 Y St
- 4921 S 95th Ave
- 10216 Gertrude Cir
- 4905 S 95th Cir
- 9924 Emiline St
- 9208 V Plaza
- 11815 Oakair Plaza
- 11611 Polk St
Your Personal Tour Guide
Ask me questions while you tour the home.