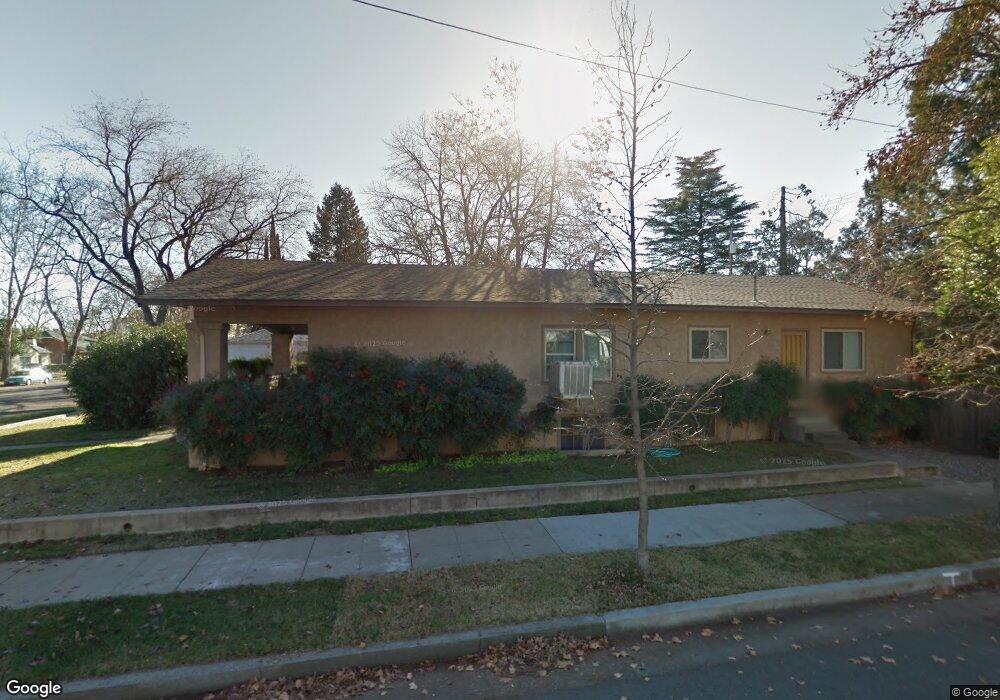
1055 Jackson St Red Bluff, CA 96080
Estimated Value: $239,000 - $271,000
3
Beds
2
Baths
1,480
Sq Ft
$172/Sq Ft
Est. Value
About This Home
This home is located at 1055 Jackson St, Red Bluff, CA 96080 and is currently estimated at $254,940, approximately $172 per square foot. 1055 Jackson St is a home located in Tehama County with nearby schools including Bidwell Elementary School, Vista Preparatory Academy, and Red Bluff High School.
Ownership History
Date
Name
Owned For
Owner Type
Purchase Details
Closed on
Dec 8, 2012
Sold by
Ebenhack Nela K
Bought by
Ebenhack Nela K
Current Estimated Value
Home Financials for this Owner
Home Financials are based on the most recent Mortgage that was taken out on this home.
Original Mortgage
$65,750
Interest Rate
3.35%
Mortgage Type
New Conventional
Purchase Details
Closed on
Jan 25, 2006
Sold by
Ebenhack Nela K
Bought by
Ebenhack Nela K
Home Financials for this Owner
Home Financials are based on the most recent Mortgage that was taken out on this home.
Original Mortgage
$66,500
Interest Rate
6.28%
Mortgage Type
New Conventional
Purchase Details
Closed on
Jul 9, 2004
Sold by
Ebenhack Nela K
Bought by
Ebenhack Nela K
Purchase Details
Closed on
Jun 14, 2004
Sold by
Ebenhack Nela K
Bought by
Ebenhack Nela K
Purchase Details
Closed on
Oct 24, 2003
Sold by
Ebenhack Nela Kim
Bought by
Ebenhack Nela K
Create a Home Valuation Report for This Property
The Home Valuation Report is an in-depth analysis detailing your home's value as well as a comparison with similar homes in the area
Purchase History
| Date | Buyer | Sale Price | Title Company |
|---|---|---|---|
| Ebenhack Nela K | -- | Placer Title Company | |
| Ebenhack Nela K | -- | Placer Title Company | |
| Ebenhack Nela K | -- | Fidelity National Title | |
| Ebenhack Nela K | -- | Fidelity National Title | |
| Ebenhack Nela K | -- | -- | |
| Ebenhack Nela K | -- | Fidelity National Title | |
| Ebenhack Nela K | -- | -- |
Source: Public Records
Mortgage History
| Date | Status | Borrower | Loan Amount |
|---|---|---|---|
| Closed | Ebenhack Nela K | $65,750 | |
| Closed | Ebenhack Nela K | $66,500 |
Source: Public Records
Tax History
| Year | Tax Paid | Tax Assessment Tax Assessment Total Assessment is a certain percentage of the fair market value that is determined by local assessors to be the total taxable value of land and additions on the property. | Land | Improvement |
|---|---|---|---|---|
| 2025 | $795 | $84,869 | $16,948 | $67,921 |
| 2023 | $780 | $81,576 | $16,291 | $65,285 |
| 2022 | $774 | $79,977 | $15,972 | $64,005 |
| 2021 | $741 | $78,409 | $15,659 | $62,750 |
| 2020 | $756 | $77,606 | $15,499 | $62,107 |
| 2019 | $759 | $76,086 | $15,196 | $60,890 |
| 2018 | $701 | $74,596 | $14,899 | $59,697 |
| 2017 | $706 | $73,134 | $14,607 | $58,527 |
| 2016 | $658 | $71,701 | $14,321 | $57,380 |
| 2015 | $647 | $70,625 | $14,106 | $56,519 |
| 2014 | $636 | $69,242 | $13,830 | $55,412 |
Source: Public Records
Map
Nearby Homes
- 927 Cedar St
- 734 Douglas St
- 734 Douglass St
- 1158 Madison St
- 855 Johnson St
- 728 Lincoln St
- 1359 2nd St
- 629 Johnson St
- 0 Jefferson St Unit SN26036140
- 532 Madison St
- 541 Jefferson St
- 524 Madison St
- 846 Rio St
- 701 Rio St
- 0 Derby Unit 24724349
- 1707 Luning St
- 1715 Walbridge St
- 1710 Luning St
- 1836 Walbridge St
- 710 Center Ave
- 1045 Jackson St
- 1035 Jackson St
- 843 Union St
- 824 Union St
- 1103 Jackson St
- 1025 Jackson St
- 1044 Lincoln St
- 1115 Jackson St
- 1054 Jackson St
- 1034 Lincoln St
- 1050 Lincoln St
- 1015 Jackson St
- 838 Union St
- 1034 Jackson St
- 1026 Lincoln St
- 1123 Jackson St
- 848 Union St
- 754 Union St
- 810 Cedar St
- 1016 Lincoln St
Your Personal Tour Guide
Ask me questions while you tour the home.