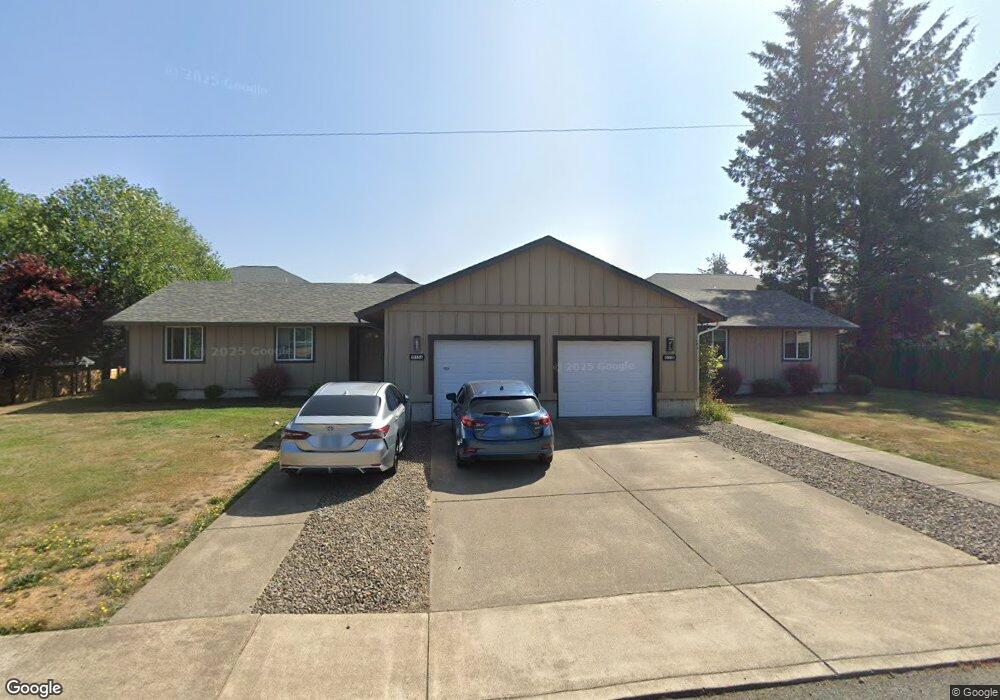
1055 Murray Way Unit A/B Tillamook, OR 97141
Estimated Value: $543,000 - $662,000
6
Beds
4
Baths
2,150
Sq Ft
$279/Sq Ft
Est. Value
About This Home
This home is located at 1055 Murray Way Unit A/B, Tillamook, OR 97141 and is currently estimated at $599,797, approximately $278 per square foot. 1055 Murray Way Unit A/B is a home located in Tillamook County with nearby schools including Tillamook High School, Tillamook Adventist School, and Little Clipper Preschool.
Ownership History
Date
Name
Owned For
Owner Type
Purchase Details
Closed on
Apr 22, 2021
Sold by
Helmick Donald L and Helmick Property 1 Llc
Bought by
Amirkhanian Ray and Logan Cathy D
Current Estimated Value
Home Financials for this Owner
Home Financials are based on the most recent Mortgage that was taken out on this home.
Original Mortgage
$341,250
Outstanding Balance
$308,599
Interest Rate
3.1%
Mortgage Type
New Conventional
Estimated Equity
$291,198
Purchase Details
Closed on
Apr 25, 2017
Sold by
Helmick Donald L and Helmick Peggy A
Bought by
Helmick Property #1 Llc
Purchase Details
Closed on
Oct 31, 2008
Sold by
Perkins Alan M
Bought by
Helmick Don
Home Financials for this Owner
Home Financials are based on the most recent Mortgage that was taken out on this home.
Original Mortgage
$46,440
Interest Rate
6.09%
Mortgage Type
Purchase Money Mortgage
Create a Home Valuation Report for This Property
The Home Valuation Report is an in-depth analysis detailing your home's value as well as a comparison with similar homes in the area
Home Values in the Area
Average Home Value in this Area
Purchase History
| Date | Buyer | Sale Price | Title Company |
|---|---|---|---|
| Amirkhanian Ray | $455,000 | Ticor Title Company Of Or | |
| Helmick Property #1 Llc | -- | None Available | |
| Helmick Don | $46,440 | First American |
Source: Public Records
Mortgage History
| Date | Status | Borrower | Loan Amount |
|---|---|---|---|
| Open | Amirkhanian Ray | $341,250 | |
| Previous Owner | Helmick Don | $46,440 |
Source: Public Records
Tax History Compared to Growth
Tax History
| Year | Tax Paid | Tax Assessment Tax Assessment Total Assessment is a certain percentage of the fair market value that is determined by local assessors to be the total taxable value of land and additions on the property. | Land | Improvement |
|---|---|---|---|---|
| 2024 | $3,411 | $284,610 | $76,960 | $207,650 |
| 2023 | $3,378 | $276,330 | $74,710 | $201,620 |
| 2022 | $3,263 | $268,290 | $72,540 | $195,750 |
| 2021 | $3,167 | $260,480 | $70,420 | $190,060 |
| 2020 | $3,080 | $252,900 | $68,370 | $184,530 |
| 2019 | $2,993 | $245,540 | $66,380 | $179,160 |
| 2018 | $2,916 | $238,390 | $64,440 | $173,950 |
| 2017 | $2,842 | $231,450 | $62,560 | $168,890 |
| 2016 | $2,736 | $224,710 | $60,740 | $163,970 |
| 2015 | $2,680 | $218,170 | $58,970 | $159,200 |
| 2014 | $2,635 | $211,820 | $57,250 | $154,570 |
| 2013 | -- | $205,660 | $55,580 | $150,080 |
Source: Public Records
Map
Nearby Homes
- 3602 Walnut Ln
- 903 Evergreen Dr
- 3413 Maple Ln
- 1110 Meadow Ave
- 0 12th St Unit 2405
- 4009 Filbert St
- TL#02600 12th St
- 4205 Ginkgo Ave
- 4004 Elmwood St
- 3607 3rd St
- V/L Marolf Loop Rd
- 2305 7th St
- 2506 1st St
- 2410 3rd St
- 2418 1st St
- 17805 U S 101 S
- Parcel 1 Wilson River Hwy
- Parcel 2 Wilson River Hwy
- 500 etc. Wilson River Hwy
- 00201 Wilson River Hwy