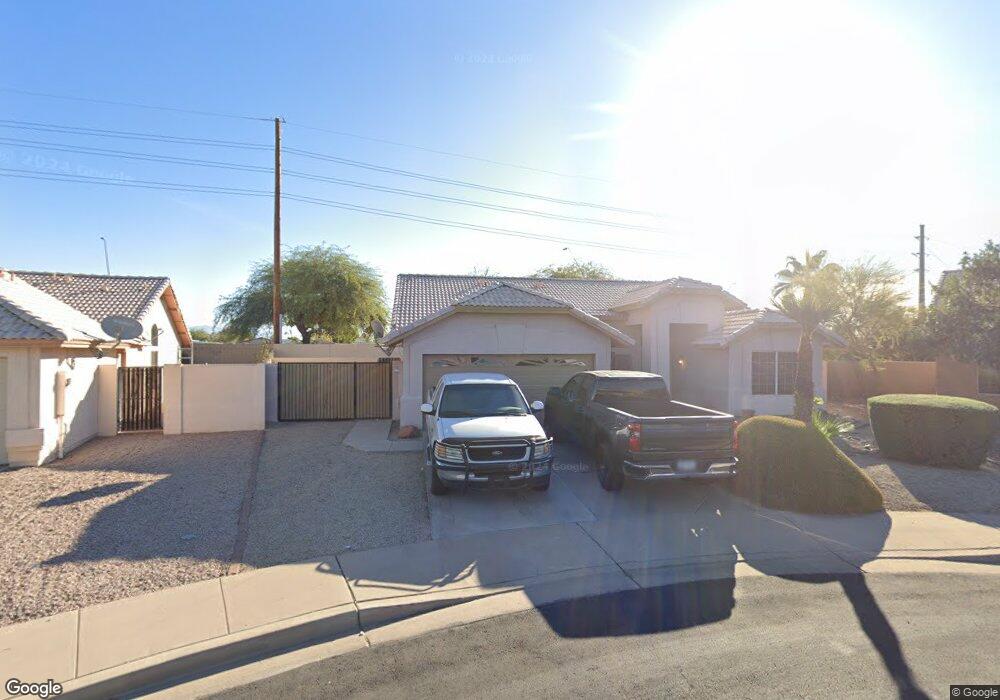
1055 S Ananea Cir Mesa, AZ 85208
Central Mesa East NeighborhoodEstimated Value: $397,550 - $474,000
--
Bed
3
Baths
1,607
Sq Ft
$268/Sq Ft
Est. Value
About This Home
This home is located at 1055 S Ananea Cir, Mesa, AZ 85208 and is currently estimated at $430,388, approximately $267 per square foot. 1055 S Ananea Cir is a home located in Maricopa County with nearby schools including Jefferson Elementary School, Franklin at Brimhall Elementary School, and Franklin West Elementary School.
Ownership History
Date
Name
Owned For
Owner Type
Purchase Details
Closed on
Mar 5, 2025
Sold by
Capps Rick A
Bought by
Rick A Capps Trust and Capps
Current Estimated Value
Purchase Details
Closed on
Apr 13, 2005
Sold by
Hawash Helmy M and Hawash Irid I
Bought by
Capps Rick A and Capps Debra G
Home Financials for this Owner
Home Financials are based on the most recent Mortgage that was taken out on this home.
Original Mortgage
$145,920
Interest Rate
6.02%
Mortgage Type
New Conventional
Purchase Details
Closed on
Apr 20, 2001
Sold by
Hawash Helmy M and Hawash Irid I
Bought by
Hawash Helmy M and Hawash Irid I
Purchase Details
Closed on
Jan 10, 1996
Sold by
Fulton Homes Corp
Bought by
Hawash Helmy M and Hawash Irid I
Create a Home Valuation Report for This Property
The Home Valuation Report is an in-depth analysis detailing your home's value as well as a comparison with similar homes in the area
Home Values in the Area
Average Home Value in this Area
Purchase History
| Date | Buyer | Sale Price | Title Company |
|---|---|---|---|
| Rick A Capps Trust | -- | None Listed On Document | |
| Capps Rick A | $182,400 | Capital Title Agency Inc | |
| Hawash Helmy M | -- | -- | |
| Hawash Helmy M | $110,642 | Security Title |
Source: Public Records
Mortgage History
| Date | Status | Borrower | Loan Amount |
|---|---|---|---|
| Previous Owner | Capps Rick A | $145,920 | |
| Closed | Capps Rick A | $36,480 |
Source: Public Records
Tax History Compared to Growth
Tax History
| Year | Tax Paid | Tax Assessment Tax Assessment Total Assessment is a certain percentage of the fair market value that is determined by local assessors to be the total taxable value of land and additions on the property. | Land | Improvement |
|---|---|---|---|---|
| 2025 | $1,639 | $19,717 | -- | -- |
| 2024 | $1,657 | $18,778 | -- | -- |
| 2023 | $1,657 | $34,110 | $6,820 | $27,290 |
| 2022 | $1,620 | $27,450 | $5,490 | $21,960 |
| 2021 | $1,665 | $24,860 | $4,970 | $19,890 |
| 2020 | $1,643 | $22,570 | $4,510 | $18,060 |
| 2019 | $1,522 | $20,260 | $4,050 | $16,210 |
| 2018 | $1,454 | $19,230 | $3,840 | $15,390 |
| 2017 | $1,408 | $17,710 | $3,540 | $14,170 |
| 2016 | $1,376 | $17,470 | $3,490 | $13,980 |
| 2015 | $1,305 | $16,800 | $3,360 | $13,440 |
Source: Public Records
Map
Nearby Homes
- 7424 E Flower Ave
- 7412 E Flower Ave
- 7714 E Flossmoor Ave
- 7646 E Gale Ave
- 1028 S 78th St
- 1231 S Palo Verde St
- 1006 S 78th Place
- 7327 E Edgewood Ave
- 905 S 78th St
- 1368 S 76th Place
- 7633 E Harmony Ave
- 7642 E Holmes Ave
- 716 S Privet Way Unit 8
- 723 S Palo Verde Way
- 617 S Arrowwood Way
- 718 S Arrowwood Way Unit 53
- 649 S Arrowwood Way
- 709 S Arrowwood Way
- 633 S 77th St Unit 33
- 7705 E Mariposa Way
- 1061 S Ananea Cir
- 1049 S Ananea Cir
- 1043 S Ananea Cir
- 1062 S Ananea Cir
- 1056 S Ananea Cir
- 1050 S Ananea Cir
- 1062 S 76th Place
- 1056 S 76th Place
- 1102 S 76th Place
- 1044 S Ananea Cir
- 1044 S 76th Place
- 1108 S 76th Place
- 1108 S 76th Place Unit 948
- 1033 S Ananea Unit 2
- 1063 S Sawyer
- 1057 S Sawyer Unit II
- 1038 S 76th Place
- 1051 S Sawyer
- 7544 E Forge Ave
- 1045 S Sawyer