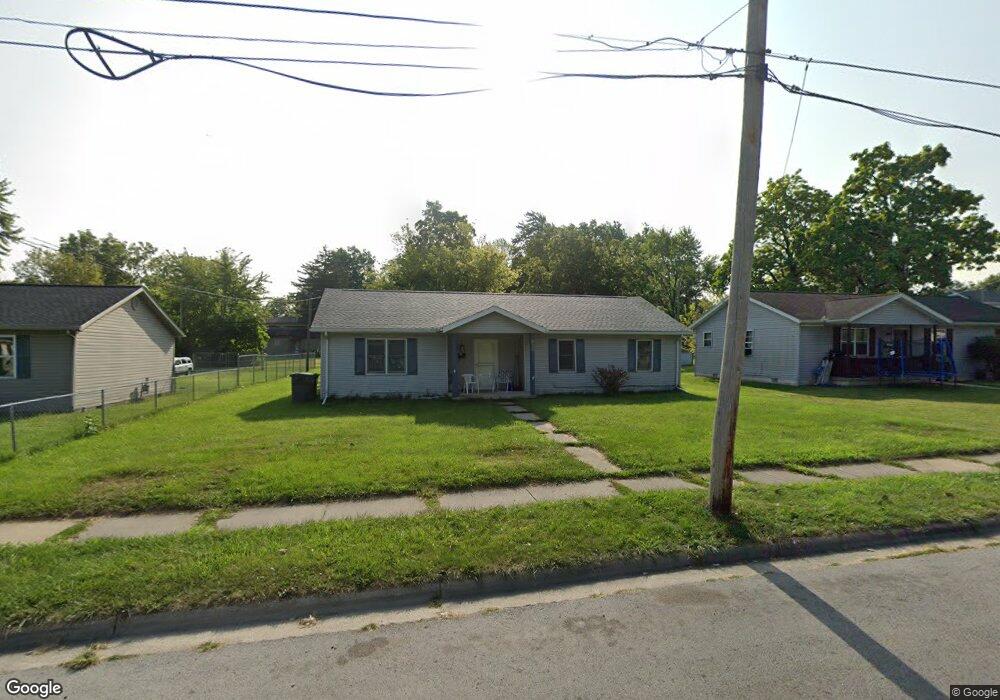
1057 Reese Ave Lima, OH 45804
Southside Lima NeighborhoodEstimated Value: $55,295 - $84,000
3
Beds
1
Bath
1,314
Sq Ft
$52/Sq Ft
Est. Value
About This Home
This home is located at 1057 Reese Ave, Lima, OH 45804 and is currently estimated at $68,324, approximately $51 per square foot. 1057 Reese Ave is a home located in Allen County with nearby schools including Unity Elementary School, Lima North Middle School, and Lima West Middle School.
Ownership History
Date
Name
Owned For
Owner Type
Purchase Details
Closed on
Sep 7, 2022
Bought by
Anika Florence
Current Estimated Value
Home Financials for this Owner
Home Financials are based on the most recent Mortgage that was taken out on this home.
Interest Rate
5.66%
Purchase Details
Closed on
Sep 6, 2022
Sold by
Anika Florence
Bought by
Florence Anika
Home Financials for this Owner
Home Financials are based on the most recent Mortgage that was taken out on this home.
Interest Rate
5.66%
Purchase Details
Closed on
Jul 1, 2016
Sold by
Hill Gail and Downton Karen
Bought by
Batty Mark D
Purchase Details
Closed on
Dec 10, 1997
Sold by
Habitat For Humanity
Bought by
Batty Gertrude
Home Financials for this Owner
Home Financials are based on the most recent Mortgage that was taken out on this home.
Original Mortgage
$28,302
Interest Rate
7.32%
Mortgage Type
New Conventional
Purchase Details
Closed on
Jun 1, 1977
Bought by
City Of Lima
Create a Home Valuation Report for This Property
The Home Valuation Report is an in-depth analysis detailing your home's value as well as a comparison with similar homes in the area
Home Values in the Area
Average Home Value in this Area
Purchase History
| Date | Buyer | Sale Price | Title Company |
|---|---|---|---|
| Anika Florence | $8,664 | -- | |
| Florence Anika | $8,700 | -- | |
| Batty Mark D | -- | None Available | |
| Batty Gertrude | $44,000 | -- | |
| City Of Lima | -- | -- |
Source: Public Records
Mortgage History
| Date | Status | Borrower | Loan Amount |
|---|---|---|---|
| Closed | Anika Florence | -- | |
| Previous Owner | Batty Gertrude | $28,302 |
Source: Public Records
Tax History Compared to Growth
Tax History
| Year | Tax Paid | Tax Assessment Tax Assessment Total Assessment is a certain percentage of the fair market value that is determined by local assessors to be the total taxable value of land and additions on the property. | Land | Improvement |
|---|---|---|---|---|
| 2024 | $514 | $12,750 | $1,930 | $10,820 |
| 2023 | $552 | $12,110 | $1,820 | $10,290 |
| 2022 | $554 | $12,110 | $1,820 | $10,290 |
| 2021 | $585 | $12,110 | $1,820 | $10,290 |
| 2020 | $550 | $10,300 | $1,440 | $8,860 |
| 2019 | $550 | $10,300 | $1,440 | $8,860 |
| 2018 | $704 | $13,620 | $1,440 | $12,180 |
| 2017 | $709 | $13,620 | $1,440 | $12,180 |
| 2016 | $737 | $13,620 | $1,440 | $12,180 |
| 2015 | $751 | $13,620 | $1,440 | $12,180 |
| 2014 | $848 | $15,620 | $1,510 | $14,110 |
| 2013 | $826 | $15,620 | $1,510 | $14,110 |
Source: Public Records
Map
Nearby Homes
- 1147 S Union St
- 516 Catalpa Ave
- 839 Saint Johns Ave
- 306 E Vine St
- 1189 S Main St
- 600 Dingledine Ave
- 639 E 4th St
- 640 E 4th St
- 1008 Fairview Ave
- 1093 S Sugar St
- 706 E Kibby St
- 865 E 4th St
- 861 E 4th St
- 380 S Pine St
- 520 Orena Ave
- 785 Holly St
- 720 S Metcalf St
- 711 W Kibby St
- 1900 Garland Ave
- 620 E Elm St Unit 1/2