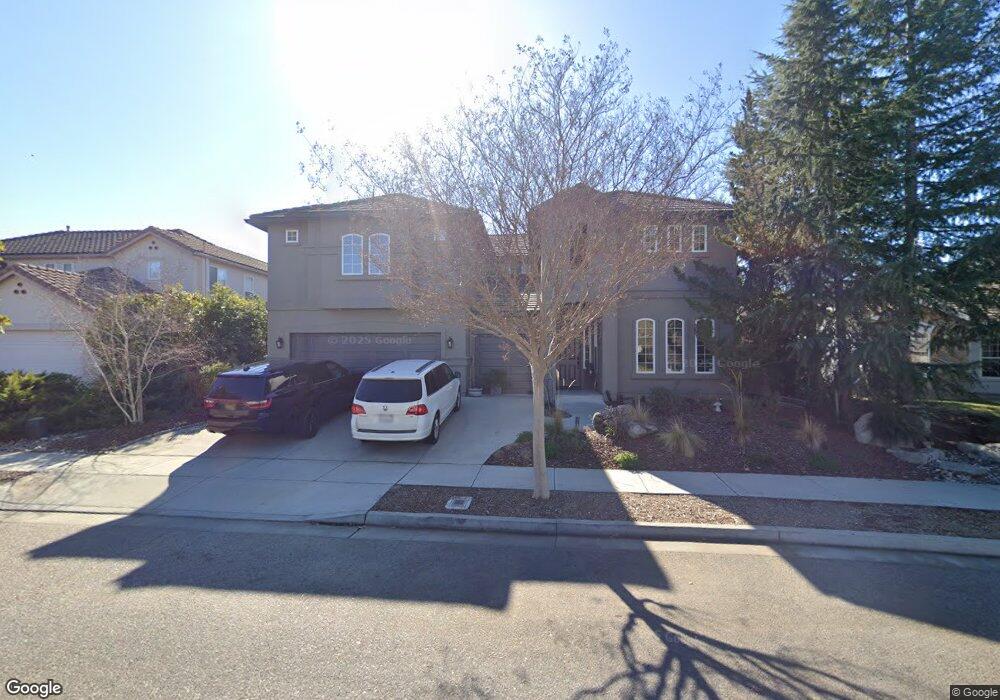
1057 Sleepy Hollow Rd Paso Robles, CA 93446
Estimated Value: $837,000 - $1,004,000
6
Beds
3
Baths
2,648
Sq Ft
$354/Sq Ft
Est. Value
About This Home
This home is located at 1057 Sleepy Hollow Rd, Paso Robles, CA 93446 and is currently estimated at $936,762, approximately $353 per square foot. 1057 Sleepy Hollow Rd is a home located in San Luis Obispo County with nearby schools including Pat Butler Elementary School, George H. Flamson Middle School, and Paso Robles High School.
Ownership History
Date
Name
Owned For
Owner Type
Purchase Details
Closed on
May 23, 2008
Sold by
Gmac Mortgage Llc
Bought by
Sackett Sage
Current Estimated Value
Home Financials for this Owner
Home Financials are based on the most recent Mortgage that was taken out on this home.
Original Mortgage
$395,100
Outstanding Balance
$251,651
Interest Rate
5.99%
Mortgage Type
Purchase Money Mortgage
Estimated Equity
$685,111
Purchase Details
Closed on
Feb 22, 2008
Sold by
Dougherty Carter D
Bought by
Gmac Mortgage Llc
Purchase Details
Closed on
Sep 19, 2003
Sold by
Harrods Inc
Bought by
Dougherty Carter D
Home Financials for this Owner
Home Financials are based on the most recent Mortgage that was taken out on this home.
Original Mortgage
$400,000
Interest Rate
5.12%
Mortgage Type
Purchase Money Mortgage
Purchase Details
Closed on
Jan 13, 2003
Sold by
Harrod Michael R and Harrod Jacquelyn Mary
Bought by
Harrods Inc
Create a Home Valuation Report for This Property
The Home Valuation Report is an in-depth analysis detailing your home's value as well as a comparison with similar homes in the area
Home Values in the Area
Average Home Value in this Area
Purchase History
| Date | Buyer | Sale Price | Title Company |
|---|---|---|---|
| Sackett Sage | $442,000 | First American Title Co | |
| Gmac Mortgage Llc | $540,000 | First American Title | |
| Dougherty Carter D | $500,000 | Chicago Title Company | |
| Harrods Inc | -- | Chicago Title Company |
Source: Public Records
Mortgage History
| Date | Status | Borrower | Loan Amount |
|---|---|---|---|
| Open | Sackett Sage | $395,100 | |
| Previous Owner | Dougherty Carter D | $400,000 | |
| Closed | Dougherty Carter D | $100,000 |
Source: Public Records
Tax History Compared to Growth
Tax History
| Year | Tax Paid | Tax Assessment Tax Assessment Total Assessment is a certain percentage of the fair market value that is determined by local assessors to be the total taxable value of land and additions on the property. | Land | Improvement |
|---|---|---|---|---|
| 2025 | $6,926 | $580,562 | $197,022 | $383,540 |
| 2024 | $6,800 | $569,179 | $193,159 | $376,020 |
| 2023 | $6,800 | $558,020 | $189,372 | $368,648 |
| 2022 | $6,680 | $547,079 | $185,659 | $361,420 |
| 2021 | $6,542 | $536,353 | $182,019 | $354,334 |
| 2020 | $6,451 | $530,854 | $180,153 | $350,701 |
| 2019 | $6,355 | $520,446 | $176,621 | $343,825 |
| 2018 | $6,231 | $510,242 | $173,158 | $337,084 |
| 2017 | $5,836 | $500,238 | $169,763 | $330,475 |
| 2016 | $5,690 | $490,431 | $166,435 | $323,996 |
| 2015 | $5,749 | $483,065 | $163,935 | $319,130 |
| 2014 | $5,554 | $473,603 | $160,724 | $312,879 |
Source: Public Records
Map
Nearby Homes
- 1050 Sleepy Hollow Rd
- 204 Nighthawk Dr
- 1337 Stoney Creek Rd
- 909 Palm Desert Ct
- 1685 Arbolado Rd
- 911 Saint Ann Dr
- 1951 Tulipwood Dr
- 17 Green Ct
- 128 Flag Way Unit A
- 1810 Laguna Del Campo
- 919 Torrey Pines Dr
- 505 Creekside Ct
- 902 Sycamore Canyon Rd
- 611 Larkfield Place
- 789 Oxen St
- 830 Sycamore Canyon Rd
- 1823 Kimberly Dr
- 1716 Wade Dr
- 924 Moran Ct
- 1835 Ponderosa Ln
- 1059 Sleepy Hollow Rd
- 1055 Sleepy Hollow Rd
- 1029 Sleepy Hollow Rd
- 1031 Sleepy Hollow Rd
- 1027 Sleepy Hollow Rd
- 1061 Sleepy Hollow Rd
- 1053 Sleepy Hollow Rd
- 1058 Sleepy Hollow Rd
- 1033 Sleepy Hollow Rd
- 1025 Sleepy Hollow Rd
- 1056 Sleepy Hollow Rd
- 1063 Sleepy Hollow Rd
- 1054 Sleepy Hollow Rd
- 1023 Sleepy Hollow Rd
- 1035 Sleepy Hollow Rd
- 1062 Sleepy Hollow Rd Unit 25
- 1062 Sleepy Hollow Rd
- 1065 Sleepy Hollow Rd
- 1052 Sleepy Hollow Rd
- 1028 Sleepy Hollow Rd