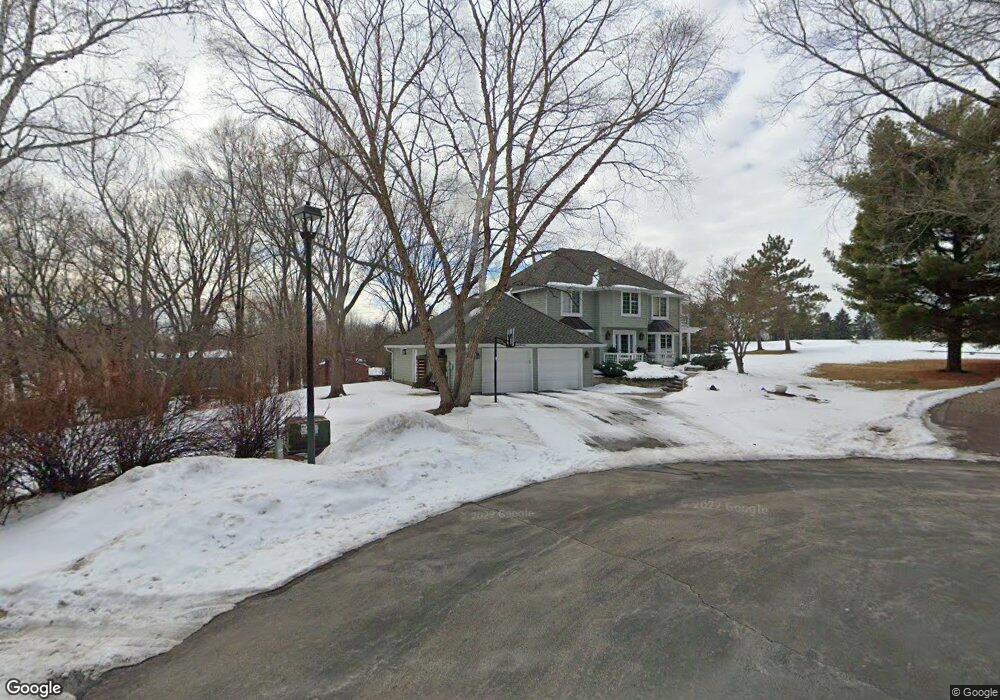
10571 Niblick Ln Eden Prairie, MN 55347
Estimated Value: $706,000 - $885,000
4
Beds
4
Baths
2,862
Sq Ft
$270/Sq Ft
Est. Value
About This Home
This home is located at 10571 Niblick Ln, Eden Prairie, MN 55347 and is currently estimated at $773,722, approximately $270 per square foot. 10571 Niblick Ln is a home located in Hennepin County with nearby schools including Eden Lake Elementary School, Central Middle School, and Eden Prairie High School.
Ownership History
Date
Name
Owned For
Owner Type
Purchase Details
Closed on
Jun 29, 2018
Sold by
Simcox Chas and Simcox Maari
Bought by
Kotila Jennifer K and Kotila Michael D
Current Estimated Value
Home Financials for this Owner
Home Financials are based on the most recent Mortgage that was taken out on this home.
Original Mortgage
$475,200
Outstanding Balance
$411,832
Interest Rate
4.5%
Mortgage Type
New Conventional
Estimated Equity
$361,890
Purchase Details
Closed on
Apr 27, 2018
Sold by
Dennis Properties Llc
Bought by
Not Provided
Purchase Details
Closed on
Oct 12, 2016
Sold by
Dennis Properties Llc
Bought by
Simcox Chas and Simcox Maari
Home Financials for this Owner
Home Financials are based on the most recent Mortgage that was taken out on this home.
Original Mortgage
$439,000
Interest Rate
3.46%
Mortgage Type
Commercial
Create a Home Valuation Report for This Property
The Home Valuation Report is an in-depth analysis detailing your home's value as well as a comparison with similar homes in the area
Home Values in the Area
Average Home Value in this Area
Purchase History
| Date | Buyer | Sale Price | Title Company |
|---|---|---|---|
| Kotila Jennifer K | $591,353 | Burnet Title | |
| Simcox Chas | $552,853 | None Available | |
| Not Provided | -- | None Available | |
| Simcox Chas | $552,853 | Attorney | |
| Dennis Properties Llc | $549,744 | Burnet Title |
Source: Public Records
Mortgage History
| Date | Status | Borrower | Loan Amount |
|---|---|---|---|
| Open | Simcox Chas | $475,200 | |
| Closed | Kotila Jennifer K | $475,200 | |
| Previous Owner | Dennis Properties Llc | $439,000 | |
| Previous Owner | Simcox Chas | $552,853 |
Source: Public Records
Tax History Compared to Growth
Tax History
| Year | Tax Paid | Tax Assessment Tax Assessment Total Assessment is a certain percentage of the fair market value that is determined by local assessors to be the total taxable value of land and additions on the property. | Land | Improvement |
|---|---|---|---|---|
| 2024 | $9,040 | $712,800 | $230,000 | $482,800 |
| 2023 | $8,351 | $698,900 | $225,500 | $473,400 |
| 2022 | $6,927 | $649,100 | $209,400 | $439,700 |
| 2021 | $6,796 | $552,000 | $178,200 | $373,800 |
| 2020 | $6,909 | $546,500 | $178,200 | $368,300 |
| 2019 | $6,680 | $538,700 | $171,400 | $367,300 |
| 2018 | $6,831 | $518,100 | $164,900 | $353,200 |
| 2017 | $6,932 | $518,100 | $164,900 | $353,200 |
| 2016 | $6,824 | $508,000 | $161,700 | $346,300 |
| 2015 | $6,661 | $477,700 | $156,800 | $320,900 |
| 2014 | -- | $455,100 | $149,400 | $305,700 |
Source: Public Records
Map
Nearby Homes
- 10382 Juniper Ln
- 10520 Grant Dr
- 10326 Balsam Ln
- 9991 Dunberry Cir
- 11007 Jackson Dr
- 9830 Squire Ln
- 11184 Johnson Ridge
- 9530 Risewood Cir
- 10246 Lee Dr
- 10529 Lee Dr
- 11332 Creekridge Dr
- 9863 Balmoral Ln
- 11362 Hawk High Ct
- 9535 Olympia Dr
- xxxx Linden Dr
- 10281 Arrowwood Dr
- 9767 Dorset Ln
- 9775 Dorset Ln
- 9529 Hartford Cir
- 9291 Amsden Way
- 9821 Cromwell Dr
- 9811 Cromwell Dr
- 10541 Niblick Ln
- 9801 Cromwell Dr
- 10460 Buckingham Dr
- 10470 Buckingham Dr
- 10450 Buckingham Dr
- 10601 Niblick Ln
- 9800 Cromwell Dr
- 10631 Niblick Ln
- 10515 Niblick Ln
- 10440 Buckingham Dr
- 9830 Cromwell Dr
- 10500 Niblick Ln
- 9810 Cromwell Dr
- 9841 Cromwell Dr
- 9820 Cromwell Dr
- 10750 Spoon Ridge
- 10490 Buckingham Dr
- 10435 Buckingham Dr