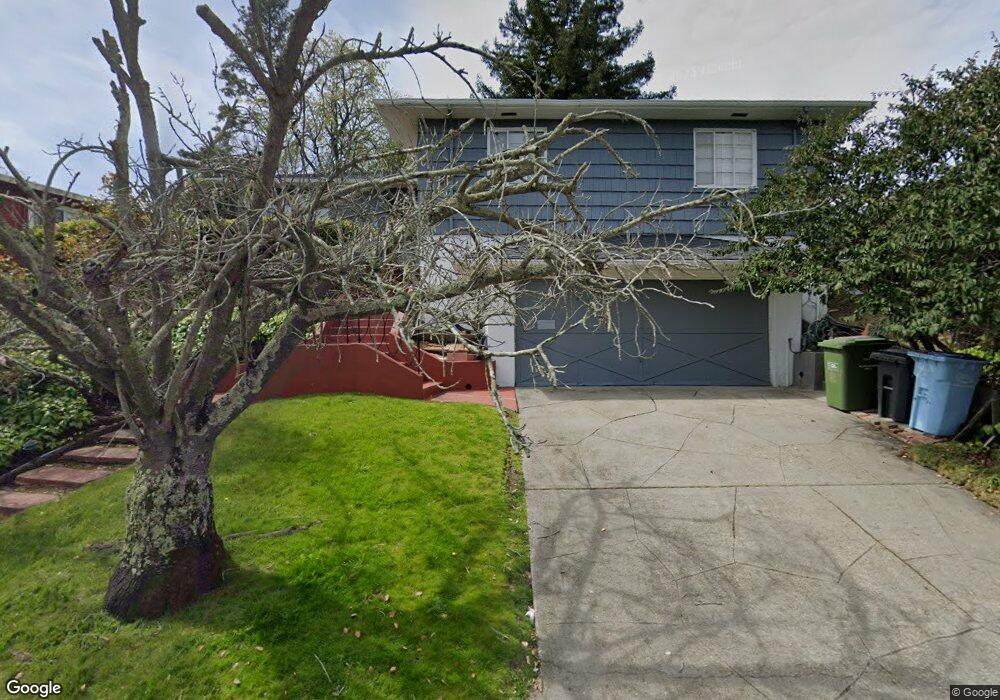
1058 Park Hills Rd Berkeley, CA 94708
Berkeley Hills NeighborhoodEstimated Value: $1,375,000 - $1,459,030
3
Beds
3
Baths
1,767
Sq Ft
$796/Sq Ft
Est. Value
About This Home
This home is located at 1058 Park Hills Rd, Berkeley, CA 94708 and is currently estimated at $1,406,508, approximately $795 per square foot. 1058 Park Hills Rd is a home located in Alameda County with nearby schools including Cragmont Elementary School, Berkeley Arts Magnet at Whittier School, and Washington Elementary School.
Ownership History
Date
Name
Owned For
Owner Type
Purchase Details
Closed on
Oct 26, 2022
Sold by
Wu Ching-Chi
Bought by
Ching-Chi Wu Living Trust and Wu
Current Estimated Value
Purchase Details
Closed on
Jan 16, 2019
Sold by
Wu Mary C
Bought by
Wu Mary C and Mary C Wu Living Trust
Purchase Details
Closed on
Dec 24, 2003
Sold by
Wu Ching Chi and Wu Mary C
Bought by
Wu Ching Chi and Wu Mary C
Home Financials for this Owner
Home Financials are based on the most recent Mortgage that was taken out on this home.
Original Mortgage
$200,000
Interest Rate
5.88%
Mortgage Type
New Conventional
Purchase Details
Closed on
Mar 9, 1994
Sold by
Wu Ching Chi and Wu Mary Chen
Bought by
Wu Ching Chi and Wu Mary C
Home Financials for this Owner
Home Financials are based on the most recent Mortgage that was taken out on this home.
Original Mortgage
$181,000
Interest Rate
4.25%
Create a Home Valuation Report for This Property
The Home Valuation Report is an in-depth analysis detailing your home's value as well as a comparison with similar homes in the area
Home Values in the Area
Average Home Value in this Area
Purchase History
| Date | Buyer | Sale Price | Title Company |
|---|---|---|---|
| Ching-Chi Wu Living Trust | -- | None Listed On Document | |
| Wu Mary C | -- | None Available | |
| Wu Ching Chi | -- | Chicago Title Co | |
| Wu Ching Chi | -- | Fidelity National Title Ins |
Source: Public Records
Mortgage History
| Date | Status | Borrower | Loan Amount |
|---|---|---|---|
| Previous Owner | Wu Ching Chi | $200,000 | |
| Previous Owner | Wu Ching Chi | $181,000 |
Source: Public Records
Tax History
| Year | Tax Paid | Tax Assessment Tax Assessment Total Assessment is a certain percentage of the fair market value that is determined by local assessors to be the total taxable value of land and additions on the property. | Land | Improvement |
|---|---|---|---|---|
| 2025 | $7,622 | $331,119 | $191,037 | $147,082 |
| 2024 | $7,622 | $324,490 | $187,292 | $144,198 |
| 2023 | $7,375 | $324,991 | $183,620 | $141,371 |
| 2022 | $7,126 | $311,620 | $180,020 | $138,600 |
| 2021 | $7,106 | $305,373 | $176,491 | $135,882 |
| 2020 | $6,633 | $309,172 | $174,682 | $134,490 |
| 2019 | $6,262 | $303,111 | $171,258 | $131,853 |
| 2018 | $6,118 | $297,168 | $167,900 | $129,268 |
| 2017 | $5,872 | $291,343 | $164,609 | $126,734 |
| 2016 | $5,597 | $285,631 | $161,382 | $124,249 |
| 2015 | $5,503 | $281,341 | $158,958 | $122,383 |
| 2014 | $5,376 | $275,831 | $155,845 | $119,986 |
Source: Public Records
Map
Nearby Homes
- 1085 Creston Rd
- 1160 Miller Ave
- 1188 Grizzly Peak Blvd
- 1024 Grizzly Peak Blvd
- 1110 Sterling Ave
- 1170 Sterling Ave
- 1183 Keeler Ave
- 1185 Keeler Ave
- 1221 Grizzly Peak Blvd
- 1181 Keeler Ave
- 1165 Cragmont Ave
- 1166 Cragmont Ave
- 935 Grizzly Peak Blvd
- 1106 Cragmont Ave
- 962 Regal Rd
- 730 Wildcat Canyon Rd
- 870 Keeler Ave
- 801 Keeler Ave
- 840 Hilldale Ave
- 1375 Queens Rd
- 1062 Park Hills Rd
- 1054 Park Hills Rd
- 1051 Overlook Rd
- 1050 Middlefield Rd
- 1061 Park Hills Rd
- 1066 Park Hills Rd
- 1055 Park Hills Rd
- 1047 Overlook Rd
- 1065 Park Hills Rd
- 1067 Park Hills Rd
- 1053 Park Hills Rd
- 1046 Middlefield Rd
- 1043 Overlook Rd
- 1071 Park Hills Rd
- 1051 Park Hills Rd
- 1068 Woodside Rd
- 1060 Overlook Rd
- 1042 Middlefield Rd
- 1068 Overlook Rd
- 1044 Park Hills Rd
Your Personal Tour Guide
Ask me questions while you tour the home.