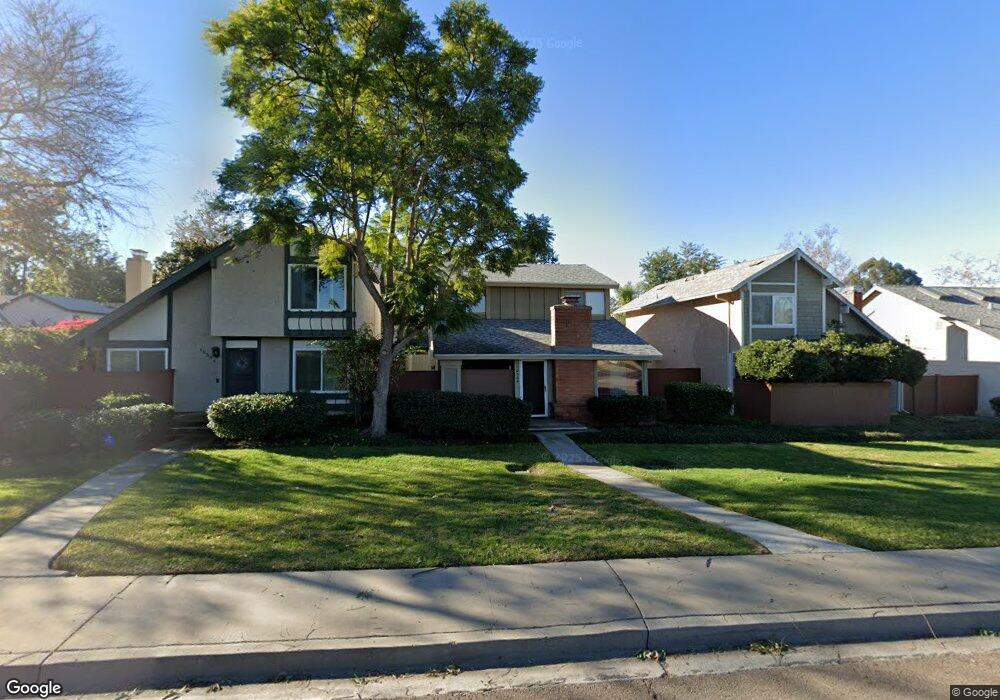
10586 Esmeraldas Dr San Diego, CA 92124
Tierrasanta NeighborhoodEstimated Value: $920,544 - $1,008,000
3
Beds
2
Baths
1,529
Sq Ft
$630/Sq Ft
Est. Value
About This Home
This home is located at 10586 Esmeraldas Dr, San Diego, CA 92124 and is currently estimated at $962,886, approximately $629 per square foot. 10586 Esmeraldas Dr is a home located in San Diego County with nearby schools including Tierrasanta Elementary, Farb Middle School, and De Portola Middle School.
Ownership History
Date
Name
Owned For
Owner Type
Purchase Details
Closed on
Jun 5, 2013
Sold by
Baudler Lothar E and Baudler Glory
Bought by
Mcgeehan Russell William and Mcgeehan Leslie
Current Estimated Value
Home Financials for this Owner
Home Financials are based on the most recent Mortgage that was taken out on this home.
Original Mortgage
$417,000
Outstanding Balance
$296,497
Interest Rate
3.48%
Mortgage Type
VA
Estimated Equity
$666,389
Purchase Details
Closed on
Nov 13, 2009
Sold by
Baudler Lothar E
Bought by
Baudler Lothar E and Baudler Glory
Purchase Details
Closed on
Feb 15, 1994
Sold by
Baudler Lothar E
Bought by
Baudler Lothar E
Home Financials for this Owner
Home Financials are based on the most recent Mortgage that was taken out on this home.
Original Mortgage
$141,600
Interest Rate
6.98%
Purchase Details
Closed on
May 30, 1990
Purchase Details
Closed on
Aug 23, 1988
Create a Home Valuation Report for This Property
The Home Valuation Report is an in-depth analysis detailing your home's value as well as a comparison with similar homes in the area
Home Values in the Area
Average Home Value in this Area
Purchase History
| Date | Buyer | Sale Price | Title Company |
|---|---|---|---|
| Mcgeehan Russell William | $450,000 | Equity Title | |
| Baudler Lothar E | -- | None Available | |
| Baudler Lothar E | -- | South Coast Title Co | |
| -- | $172,000 | -- | |
| -- | $135,000 | -- |
Source: Public Records
Mortgage History
| Date | Status | Borrower | Loan Amount |
|---|---|---|---|
| Open | Mcgeehan Russell William | $417,000 | |
| Previous Owner | Baudler Lothar E | $141,600 |
Source: Public Records
Tax History Compared to Growth
Tax History
| Year | Tax Paid | Tax Assessment Tax Assessment Total Assessment is a certain percentage of the fair market value that is determined by local assessors to be the total taxable value of land and additions on the property. | Land | Improvement |
|---|---|---|---|---|
| 2025 | $6,721 | $554,128 | $338,635 | $215,493 |
| 2024 | $6,721 | $543,264 | $331,996 | $211,268 |
| 2023 | $6,569 | $532,613 | $325,487 | $207,126 |
| 2022 | $6,389 | $522,170 | $319,105 | $203,065 |
| 2021 | $6,339 | $511,933 | $312,849 | $199,084 |
| 2020 | $6,261 | $506,685 | $309,642 | $197,043 |
| 2019 | $6,148 | $496,751 | $303,571 | $193,180 |
| 2018 | $5,749 | $487,012 | $297,619 | $189,393 |
| 2017 | $80 | $477,464 | $291,784 | $185,680 |
| 2016 | $5,519 | $468,103 | $286,063 | $182,040 |
| 2015 | $5,436 | $461,073 | $281,767 | $179,306 |
| 2014 | $5,349 | $452,042 | $276,248 | $175,794 |
Source: Public Records
Map
Nearby Homes
- 10690 Esmeraldas Dr
- 10706 Esmeraldas Dr Unit 6
- 10617 Escobar Dr Unit 4
- 6140 Calle Mariselda Unit 102
- 10748 Escobar Dr
- 10437 Hermanos Rd
- 5450 Rebolla Ln
- 5367 Outlook Point
- 10828 Lamentin Ct Unit 313
- 10812 Lamentin Ct Unit 312
- 5137 Abuela Dr
- 5449 Escarchosa Ln
- 10140 Gayuba Ln
- 10165 Gayuba Ln Unit 311
- 10889 Lamentin Ct
- 10834 Caravelle Place
- 5283 Edge Park Way
- 10945 Clairemont Mesa Blvd
- 6161 Calle Mariselda Unit 408
- 5059 La Cuenta Dr
- 10578 Esmeraldas Dr
- 10594 Esmeraldas Dr Unit 1
- 10570 Esmeraldas Dr
- 10585 Esmeraldas Dr
- 10577 Esmeraldas Dr
- 10593 Esmeraldas Dr
- 10562 Esmeraldas Dr
- 10569 Esmeraldas Dr
- 5285 Fino Dr
- 5295 Fino Dr
- 5275 Fino Dr
- 10561 Esmeraldas Dr
- 10554 Esmeraldas Dr
- 5265 Fino Dr
- 5255 Fino Dr
- 10553 Esmeraldas Dr Unit 1
- 10553 Esmeraldas Dr
- 5256 Fino Dr
- 5258 Fino Dr
- 5254 Fino Dr