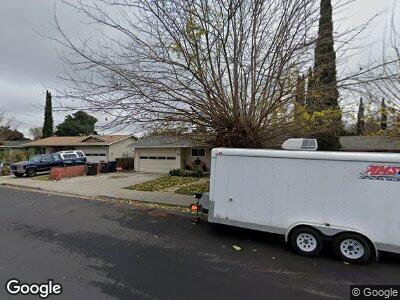
1059 Mocho St Livermore, CA 94550
Sunset West NeighborhoodEstimated Value: $1,137,000 - $1,287,000
3
Beds
2
Baths
1,644
Sq Ft
$743/Sq Ft
Est. Value
About This Home
This home is located at 1059 Mocho St, Livermore, CA 94550 and is currently estimated at $1,222,125, approximately $743 per square foot. 1059 Mocho St is a home located in Alameda County with nearby schools including Joe Michell K-8 School, Granada High School, and St Michael's School.
Ownership History
Date
Name
Owned For
Owner Type
Purchase Details
Closed on
Apr 22, 2005
Sold by
Mocho Street Venture
Bought by
Poage King William R and Poage King Leslie A
Current Estimated Value
Home Financials for this Owner
Home Financials are based on the most recent Mortgage that was taken out on this home.
Original Mortgage
$462,400
Interest Rate
1%
Mortgage Type
Purchase Money Mortgage
Purchase Details
Closed on
Nov 1, 2004
Sold by
Himes John C and Mortgage Electronic Registrati
Bought by
Mocho Street Venture
Purchase Details
Closed on
May 13, 1994
Sold by
Olesen Orville C and Olesen Betty E
Bought by
Himes John C
Home Financials for this Owner
Home Financials are based on the most recent Mortgage that was taken out on this home.
Original Mortgage
$173,700
Interest Rate
8.35%
Create a Home Valuation Report for This Property
The Home Valuation Report is an in-depth analysis detailing your home's value as well as a comparison with similar homes in the area
Home Values in the Area
Average Home Value in this Area
Purchase History
| Date | Buyer | Sale Price | Title Company |
|---|---|---|---|
| Poage King William R | $578,000 | North American Title Co | |
| Mocho Street Venture | $447,000 | -- | |
| Himes John C | $193,000 | Chicago Title Company |
Source: Public Records
Mortgage History
| Date | Status | Borrower | Loan Amount |
|---|---|---|---|
| Open | King Leslie A Poage | $548,250 | |
| Closed | Poage King William R | $462,400 | |
| Previous Owner | Himes John C | $213,000 | |
| Previous Owner | Himes John C | $216,000 | |
| Previous Owner | Himes John C | $208,000 | |
| Previous Owner | Himes John C | $173,700 | |
| Closed | Poage King William R | $57,800 |
Source: Public Records
Tax History Compared to Growth
Tax History
| Year | Tax Paid | Tax Assessment Tax Assessment Total Assessment is a certain percentage of the fair market value that is determined by local assessors to be the total taxable value of land and additions on the property. | Land | Improvement |
|---|---|---|---|---|
| 2024 | $10,031 | $782,813 | $236,944 | $552,869 |
| 2023 | $9,886 | $774,328 | $232,298 | $542,030 |
| 2022 | $9,748 | $752,150 | $227,745 | $531,405 |
| 2021 | $8,810 | $737,267 | $223,280 | $520,987 |
| 2020 | $9,279 | $736,637 | $220,991 | $515,646 |
| 2019 | $9,321 | $722,198 | $216,659 | $505,539 |
| 2018 | $9,128 | $708,043 | $212,413 | $495,630 |
| 2017 | $8,897 | $694,165 | $208,249 | $485,916 |
| 2016 | $8,154 | $644,000 | $193,200 | $450,800 |
| 2015 | $7,601 | $630,000 | $189,000 | $441,000 |
| 2014 | $6,834 | $560,000 | $168,000 | $392,000 |
Source: Public Records
Map
Nearby Homes
- 1009 Murrieta Blvd Unit 5
- 1087 Murrieta Blvd Unit 244
- 1087 Murrieta Blvd Unit 151
- 1087 Murrieta Blvd Unit 349
- 831 Wagoner Dr
- 1001 Murrieta Blvd Unit 88
- 1085 Murrieta Blvd Unit 318
- 1085 Murrieta Blvd Unit 305
- 975 Murrieta Blvd Unit 47
- 975 Murrieta Blvd Unit 46
- 975 Murrieta Blvd Unit 38
- 1196 Holmes Ct
- 1205 Marguerite St
- 1079 El Dorado Dr
- 1124 Via Granada
- 227 Holmes St
- 773 Grace Ct
- 937 Florence Rd
- 322 Nadine St
- 850 El Rancho Dr