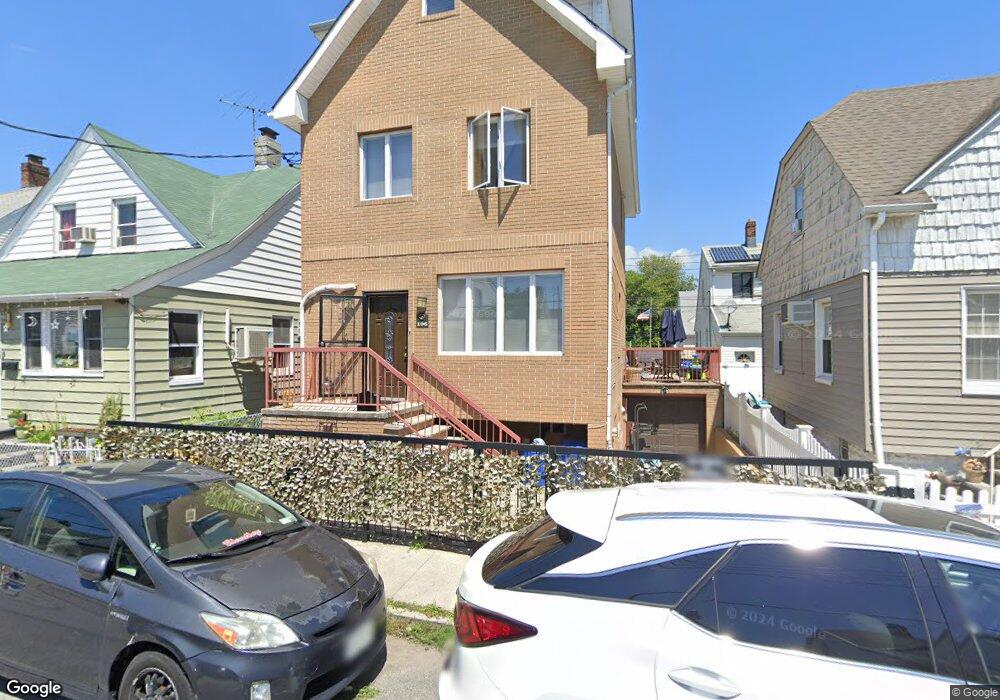
106 Ebony Ct Brooklyn, NY 11229
Gerritsen Beach NeighborhoodEstimated Value: $841,000 - $1,073,795
--
Bed
--
Bath
3,012
Sq Ft
$322/Sq Ft
Est. Value
About This Home
This home is located at 106 Ebony Ct, Brooklyn, NY 11229 and is currently estimated at $969,949, approximately $322 per square foot. 106 Ebony Ct is a home located in Kings County with nearby schools including P.S. 277 Gerritsen Beach, J.H.S. 278 Marine Park, and New Visions Charter High School for Advanced Math/ Science.
Ownership History
Date
Name
Owned For
Owner Type
Purchase Details
Closed on
Oct 31, 2017
Sold by
Golembiewski Edward and Golembiewski Lucille
Bought by
Aly Yasser
Current Estimated Value
Home Financials for this Owner
Home Financials are based on the most recent Mortgage that was taken out on this home.
Original Mortgage
$420,000
Outstanding Balance
$350,068
Interest Rate
3.83%
Mortgage Type
New Conventional
Estimated Equity
$619,881
Purchase Details
Closed on
Mar 30, 2007
Sold by
Wais Adalbert
Bought by
Golembiewski Edward and Golembiewski Lucille
Home Financials for this Owner
Home Financials are based on the most recent Mortgage that was taken out on this home.
Original Mortgage
$400,000
Interest Rate
6.24%
Mortgage Type
Purchase Money Mortgage
Purchase Details
Closed on
Sep 13, 2004
Sold by
Satyr Marina and Satyr Sergey
Bought by
Wais Adalbert
Create a Home Valuation Report for This Property
The Home Valuation Report is an in-depth analysis detailing your home's value as well as a comparison with similar homes in the area
Home Values in the Area
Average Home Value in this Area
Purchase History
| Date | Buyer | Sale Price | Title Company |
|---|---|---|---|
| Aly Yasser | $700,000 | -- | |
| Aly Yasser | $700,000 | -- | |
| Golembiewski Edward | $550,000 | -- | |
| Golembiewski Edward | $550,000 | -- | |
| Wais Adalbert | $112,000 | -- | |
| Wais Adalbert | $112,000 | -- |
Source: Public Records
Mortgage History
| Date | Status | Borrower | Loan Amount |
|---|---|---|---|
| Open | Aly Yasser | $420,000 | |
| Closed | Aly Yasser | $420,000 | |
| Previous Owner | Golembiewski Edward | $400,000 |
Source: Public Records
Tax History Compared to Growth
Tax History
| Year | Tax Paid | Tax Assessment Tax Assessment Total Assessment is a certain percentage of the fair market value that is determined by local assessors to be the total taxable value of land and additions on the property. | Land | Improvement |
|---|---|---|---|---|
| 2025 | $7,532 | $79,320 | $8,280 | $71,040 |
| 2024 | $7,532 | $87,000 | $8,280 | $78,720 |
| 2023 | $7,559 | $82,380 | $8,280 | $74,100 |
| 2022 | $7,009 | $71,580 | $8,280 | $63,300 |
| 2021 | $6,971 | $55,260 | $8,280 | $46,980 |
| 2020 | $6,577 | $58,740 | $8,280 | $50,460 |
| 2019 | $6,537 | $46,680 | $8,280 | $38,400 |
| 2018 | $6,322 | $31,015 | $5,871 | $25,144 |
| 2017 | $5,665 | $29,260 | $6,349 | $22,911 |
| 2016 | $5,208 | $27,604 | $5,834 | $21,770 |
| 2015 | $3,110 | $26,042 | $8,232 | $17,810 |
| 2014 | $3,110 | $26,042 | $8,232 | $17,810 |
Source: Public Records
Map
Nearby Homes
- 97 Ebony Ct
- 108 Celeste Ct
- 103 Aster Ct
- 81 Dictum Ct
- 2320 Plumb 2nd St
- 2492 Gerritsen Ave
- 103 Fane Ct
- 2472 Stuart St
- 108 Garland Ct
- 53 Dictum Ct
- 52 Dictum Ct
- 55 Aster Ct
- 3168 Whitney Ave
- 2346 Brigham St
- 2455 Stuart St
- 2369 Bragg St
- 3076 Avenue X
- 2270 Plumb 1st St Unit 4F
- 2270 Plumb 1st St Unit 6H
- 3171 Whitney Ave Unit 1B