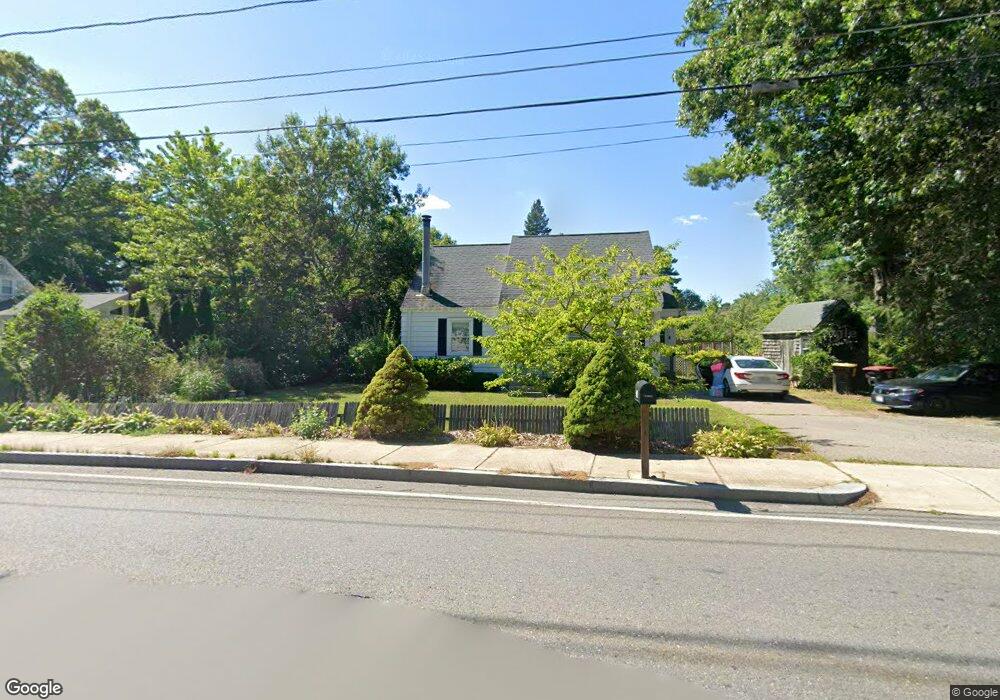
106 Freeman St Norton, MA 02766
Estimated Value: $486,532 - $580,000
2
Beds
2
Baths
1,272
Sq Ft
$424/Sq Ft
Est. Value
About This Home
This home is located at 106 Freeman St, Norton, MA 02766 and is currently estimated at $539,633, approximately $424 per square foot. 106 Freeman St is a home located in Bristol County with nearby schools including J.C. Solmonese Elementary School, Henri A. Yelle Elementary School, and Norton Middle School.
Ownership History
Date
Name
Owned For
Owner Type
Purchase Details
Closed on
Sep 2, 1988
Sold by
Riley Thomas R
Bought by
Benkart Charles L
Current Estimated Value
Home Financials for this Owner
Home Financials are based on the most recent Mortgage that was taken out on this home.
Original Mortgage
$117,500
Interest Rate
10.38%
Mortgage Type
Purchase Money Mortgage
Create a Home Valuation Report for This Property
The Home Valuation Report is an in-depth analysis detailing your home's value as well as a comparison with similar homes in the area
Home Values in the Area
Average Home Value in this Area
Purchase History
| Date | Buyer | Sale Price | Title Company |
|---|---|---|---|
| Benkart Charles L | $139,000 | -- |
Source: Public Records
Mortgage History
| Date | Status | Borrower | Loan Amount |
|---|---|---|---|
| Open | Benkart Charles L | $11,500 | |
| Open | Benkart Charles L | $115,000 | |
| Closed | Benkart Charles L | $118,000 | |
| Closed | Benkart Charles L | $117,500 |
Source: Public Records
Tax History
| Year | Tax Paid | Tax Assessment Tax Assessment Total Assessment is a certain percentage of the fair market value that is determined by local assessors to be the total taxable value of land and additions on the property. | Land | Improvement |
|---|---|---|---|---|
| 2025 | $50 | $385,700 | $178,800 | $206,900 |
| 2024 | $4,500 | $347,500 | $170,300 | $177,200 |
| 2023 | $4,261 | $328,000 | $160,600 | $167,400 |
| 2022 | $4,147 | $290,800 | $146,000 | $144,800 |
| 2021 | $0 | $263,400 | $139,100 | $124,300 |
| 2020 | $3,784 | $255,700 | $135,000 | $120,700 |
| 2019 | $0 | $246,100 | $129,900 | $116,200 |
| 2018 | $102 | $233,200 | $129,900 | $103,300 |
| 2017 | $3,466 | $225,500 | $129,900 | $95,600 |
| 2016 | $3,387 | $217,000 | $129,900 | $87,100 |
| 2015 | $3,269 | $212,400 | $127,300 | $85,100 |
| 2014 | $3,109 | $202,300 | $121,200 | $81,100 |
Source: Public Records
Map
Nearby Homes
- 93 Mansfield Ave
- 27 Smith St Unit 11
- 5 Robin Cir Unit 5
- 1 Robin Cir Unit 2
- 157 Mansfield Ave Unit 14
- 95 Godfrey Dr
- 65 Godfrey Dr Unit 65
- 10 Ridge Rd
- 250 Mansfield Ave Unit 11
- 21 Juniper Rd
- 6 Rumford Rd
- 268 Reservoir St
- 143 Oak St Unit 10
- 0 Brook Pkwy
- 0 Cobb St
- 34R Pine St
- 26 Barrows Ct
- 20 Lloyd Cir Unit 32
- 14 Lloyd Cir Unit 29
- 34 Barrows St
Your Personal Tour Guide
Ask me questions while you tour the home.