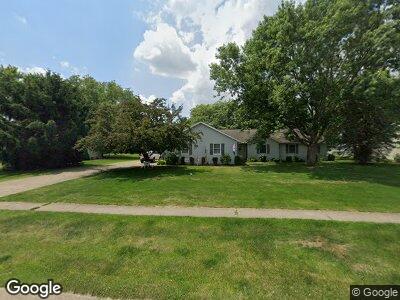
106 Hemlock Dr Creston, OH 44217
Estimated Value: $300,895 - $333,000
3
Beds
2
Baths
1,724
Sq Ft
$182/Sq Ft
Est. Value
About This Home
This home is located at 106 Hemlock Dr, Creston, OH 44217 and is currently estimated at $312,974, approximately $181 per square foot. 106 Hemlock Dr is a home located in Wayne County with nearby schools including Norwayne Elementary School, Norwayne Middle School, and Norwayne High School.
Ownership History
Date
Name
Owned For
Owner Type
Purchase Details
Closed on
May 17, 2019
Sold by
Bowers John David and Bowers Barbara J
Bought by
Bowers John David and Bowers Barbara J
Current Estimated Value
Home Financials for this Owner
Home Financials are based on the most recent Mortgage that was taken out on this home.
Original Mortgage
$50,000
Interest Rate
3.9%
Mortgage Type
New Conventional
Purchase Details
Closed on
Mar 24, 2019
Sold by
Estate Of Wilbur Bowers
Bought by
Bowers John David and Bowers Timothy Lee
Home Financials for this Owner
Home Financials are based on the most recent Mortgage that was taken out on this home.
Original Mortgage
$50,000
Interest Rate
3.9%
Mortgage Type
New Conventional
Purchase Details
Closed on
Feb 23, 2019
Sold by
Bowers Timothy Lee
Bought by
Bowers John David
Purchase Details
Closed on
Oct 6, 1997
Sold by
Pine Street Ptns
Bought by
Bowers Wilbur L and Bowers Ellen M
Create a Home Valuation Report for This Property
The Home Valuation Report is an in-depth analysis detailing your home's value as well as a comparison with similar homes in the area
Home Values in the Area
Average Home Value in this Area
Purchase History
| Date | Buyer | Sale Price | Title Company |
|---|---|---|---|
| Bowers John David | -- | None Available | |
| Bowers John David | -- | Transfer Title Agency Inc | |
| Bowers John David | $101,400 | Transfer Title Agency Inc | |
| Bowers Wilbur L | $19,900 | -- |
Source: Public Records
Mortgage History
| Date | Status | Borrower | Loan Amount |
|---|---|---|---|
| Open | Bowers John David | $69,724 | |
| Closed | Bowers John David | $50,000 |
Source: Public Records
Tax History Compared to Growth
Tax History
| Year | Tax Paid | Tax Assessment Tax Assessment Total Assessment is a certain percentage of the fair market value that is determined by local assessors to be the total taxable value of land and additions on the property. | Land | Improvement |
|---|---|---|---|---|
| 2024 | $3,679 | $83,980 | $20,220 | $63,760 |
| 2023 | $3,667 | $83,980 | $20,220 | $63,760 |
| 2022 | $3,115 | $62,670 | $15,090 | $47,580 |
| 2021 | $2,822 | $62,670 | $15,090 | $47,580 |
| 2020 | $2,836 | $62,670 | $15,090 | $47,580 |
| 2019 | $2,514 | $55,030 | $13,450 | $41,580 |
| 2018 | $2,074 | $55,030 | $13,450 | $41,580 |
| 2017 | $1,890 | $55,030 | $13,450 | $41,580 |
| 2016 | $1,740 | $48,930 | $12,940 | $35,990 |
| 2015 | $1,720 | $48,930 | $12,940 | $35,990 |
| 2014 | $1,735 | $48,930 | $12,940 | $35,990 |
| 2013 | $1,790 | $49,010 | $11,760 | $37,250 |
Source: Public Records
Map
Nearby Homes
- 13343 Cleveland Rd
- 3 Myers St
- Lots #2-4 Myers St
- 4 Myers St
- 46 Navajo St
- 13 Cherokee Ln
- 72 Shawnee Ln
- 0 Burbank St
- 13300 Canaan Center Rd
- 130 N Main St
- 4505 Doylestown Rd
- 10094 Friendsville Rd
- 35 W Maple Dr
- 9376 Daniels Rd
- 9330 Daniels Rd
- 64 High St
- 5048 Catawba Place Ln
- 5058 Catawba Place Ln
- 3285 Greenwich Rd
- 5220 Greenwich Rd Unit 7