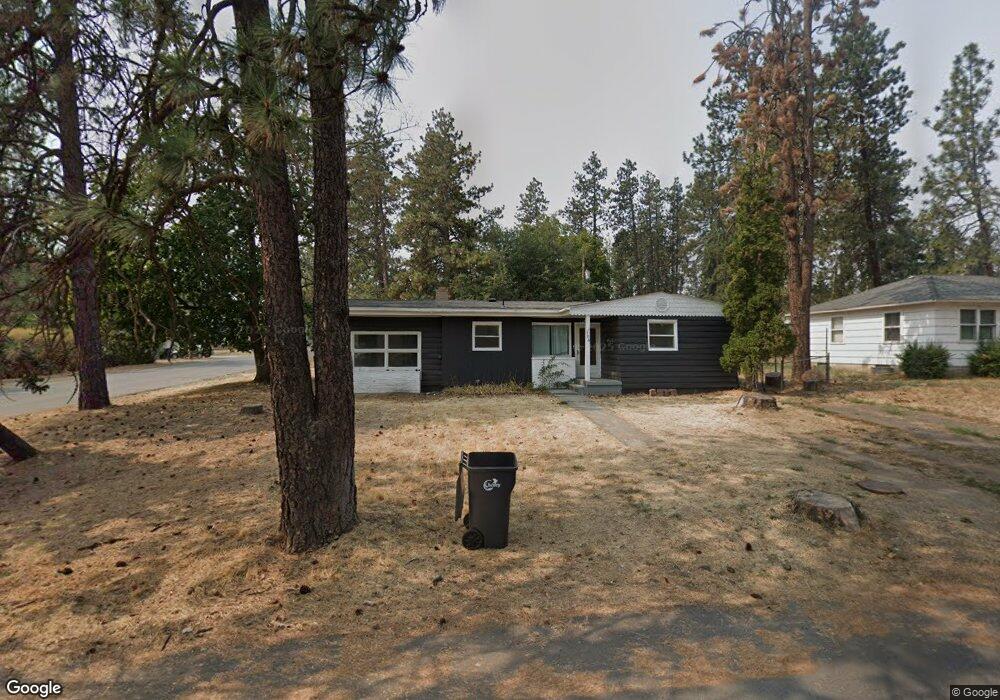
106 N 3rd St Cheney, WA 99004
Estimated Value: $286,000 - $325,000
4
Beds
2
Baths
1,513
Sq Ft
$204/Sq Ft
Est. Value
About This Home
This home is located at 106 N 3rd St, Cheney, WA 99004 and is currently estimated at $309,098, approximately $204 per square foot. 106 N 3rd St is a home located in Spokane County with nearby schools including Betz Elementary School, Cheney Middle School, and Cheney High School.
Ownership History
Date
Name
Owned For
Owner Type
Purchase Details
Closed on
Dec 22, 2004
Sold by
Jared Vincent M
Bought by
Tanzer John P and Tanzer Marcia L
Current Estimated Value
Home Financials for this Owner
Home Financials are based on the most recent Mortgage that was taken out on this home.
Original Mortgage
$79,866
Outstanding Balance
$40,077
Interest Rate
5.76%
Mortgage Type
Purchase Money Mortgage
Estimated Equity
$269,021
Purchase Details
Closed on
Jul 16, 2003
Sold by
Strang Eric Michael and Strang Jennifer Lynne
Bought by
Jared Vincent M
Home Financials for this Owner
Home Financials are based on the most recent Mortgage that was taken out on this home.
Original Mortgage
$60,000
Interest Rate
5.18%
Mortgage Type
Purchase Money Mortgage
Purchase Details
Closed on
Mar 7, 2000
Sold by
Strang Jennifer Lynne
Bought by
Strang Jennifer Lynne and Strang Eric Michael
Create a Home Valuation Report for This Property
The Home Valuation Report is an in-depth analysis detailing your home's value as well as a comparison with similar homes in the area
Purchase History
| Date | Buyer | Sale Price | Title Company |
|---|---|---|---|
| Tanzer John P | $88,739 | First American Title Ins | |
| Jared Vincent M | -- | First American Title Ins | |
| Strang Jennifer Lynne | -- | Spokane County Title Co |
Source: Public Records
Mortgage History
| Date | Status | Borrower | Loan Amount |
|---|---|---|---|
| Open | Tanzer John P | $79,866 | |
| Previous Owner | Jared Vincent M | $60,000 | |
| Closed | Jared Vincent M | $15,000 |
Source: Public Records
Tax History
| Year | Tax Paid | Tax Assessment Tax Assessment Total Assessment is a certain percentage of the fair market value that is determined by local assessors to be the total taxable value of land and additions on the property. | Land | Improvement |
|---|---|---|---|---|
| 2025 | $3,119 | $293,500 | $75,000 | $218,500 |
| 2024 | $3,119 | $282,700 | $75,000 | $207,700 |
| 2023 | $2,312 | $275,600 | $75,000 | $200,600 |
| 2022 | $1,943 | $275,600 | $75,000 | $200,600 |
| 2021 | $1,907 | $166,400 | $31,500 | $134,900 |
| 2020 | $1,851 | $151,400 | $30,000 | $121,400 |
| 2019 | $1,568 | $134,900 | $28,000 | $106,900 |
| 2018 | $1,757 | $131,700 | $28,000 | $103,700 |
| 2017 | $1,564 | $129,500 | $28,000 | $101,500 |
| 2016 | $1,462 | $116,600 | $28,000 | $88,600 |
| 2015 | $1,406 | $114,000 | $28,000 | $86,000 |
| 2014 | -- | $114,000 | $28,000 | $86,000 |
| 2013 | -- | $0 | $0 | $0 |
Source: Public Records
Map
Nearby Homes
- 1239 1st St
- 910 2nd St
- 821 3rd St
- 417 C St
- 5339 W Anderson Rd
- 1721 5th St
- 317 College Ave
- 422 4th St
- 318 Plum Tree Ct Unit Lot 10 Block 3 - Sno
- 314 Plum Tree Ct Unit Lot 20 Block 3 - Sno
- 2331 Annie Place Unit Lot 12 Block 3 - Sno
- 2326 Annie Place
- 317 Peach Tree Ct
- 313 Apple Tree Ct
- 329 Peach Tree Ct Unit Lot 1 Block 3 - Snow
- 311 Peach Tree Ct
- 323 Peach Tree Ct
- 307 Peach Tree Ct
- 323 5th St
- 302 Peach Tree Ct
Your Personal Tour Guide
Ask me questions while you tour the home.