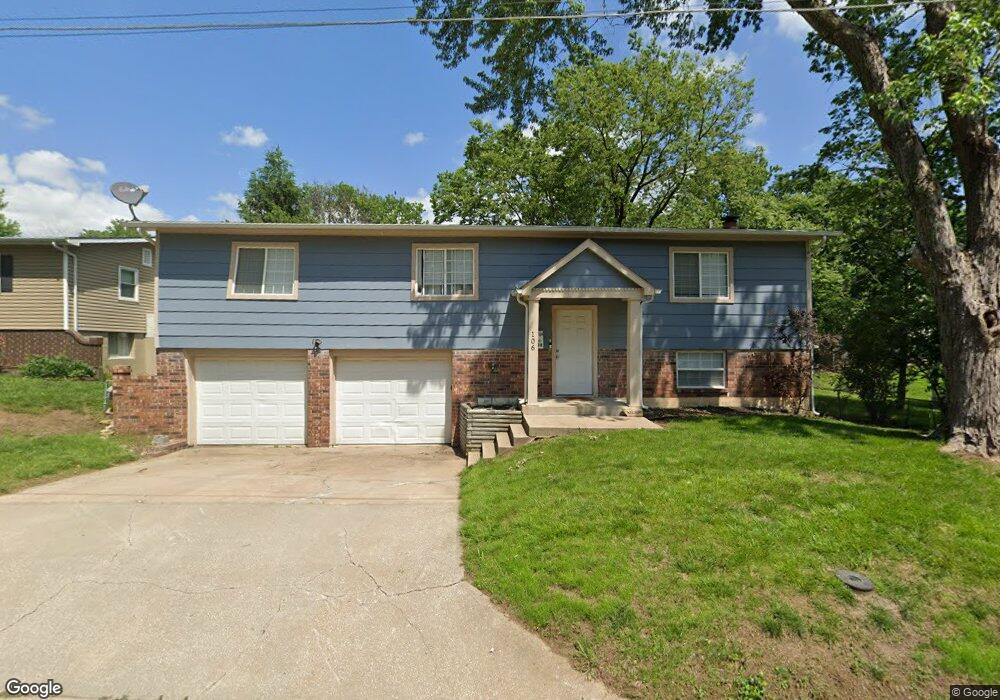
106 N Logan St Olathe, KS 66061
Estimated Value: $253,000 - $321,000
3
Beds
2
Baths
1,200
Sq Ft
$245/Sq Ft
Est. Value
About This Home
This home is located at 106 N Logan St, Olathe, KS 66061 and is currently estimated at $293,937, approximately $244 per square foot. 106 N Logan St is a home located in Johnson County with nearby schools including Westview Elementary School, Oregon Trail Middle School, and Olathe West High School.
Ownership History
Date
Name
Owned For
Owner Type
Purchase Details
Closed on
Oct 2, 2020
Sold by
Fkh Sfr Propco Bhld Lp
Bought by
Fkh Sfr Propco Bhld Lp
Current Estimated Value
Home Financials for this Owner
Home Financials are based on the most recent Mortgage that was taken out on this home.
Original Mortgage
$2,499,307
Outstanding Balance
$2,218,948
Interest Rate
2.8%
Mortgage Type
Commercial
Estimated Equity
-$1,925,011
Purchase Details
Closed on
May 30, 2017
Sold by
Soucek Charles D and The Lazy B Revocable Trust
Bought by
Stauffer Properties Llc
Home Financials for this Owner
Home Financials are based on the most recent Mortgage that was taken out on this home.
Original Mortgage
$659,790
Interest Rate
3.97%
Mortgage Type
Construction
Purchase Details
Closed on
Jan 8, 2014
Sold by
Lazy B One Llc
Bought by
Lazy B Revocable Trust
Purchase Details
Closed on
Feb 12, 2008
Sold by
Soucek Charles D and Soucek Lavaun F
Bought by
Lazy B One Llc
Create a Home Valuation Report for This Property
The Home Valuation Report is an in-depth analysis detailing your home's value as well as a comparison with similar homes in the area
Home Values in the Area
Average Home Value in this Area
Purchase History
| Date | Buyer | Sale Price | Title Company |
|---|---|---|---|
| Fkh Sfr Propco Bhld Lp | -- | Os National Llc | |
| Stauffer Properties Llc | -- | None Available | |
| Lazy B Revocable Trust | -- | None Available | |
| Lazy B One Llc | -- | None Available |
Source: Public Records
Mortgage History
| Date | Status | Borrower | Loan Amount |
|---|---|---|---|
| Open | Fkh Sfr Propco Bhld Lp | $2,499,307 | |
| Closed | Stauffer Properties Llc | $659,790 |
Source: Public Records
Tax History Compared to Growth
Tax History
| Year | Tax Paid | Tax Assessment Tax Assessment Total Assessment is a certain percentage of the fair market value that is determined by local assessors to be the total taxable value of land and additions on the property. | Land | Improvement |
|---|---|---|---|---|
| 2024 | $3,016 | $27,381 | $4,603 | $22,778 |
| 2023 | $2,848 | $25,162 | $4,603 | $20,559 |
| 2022 | $2,692 | $23,138 | $4,185 | $18,953 |
| 2021 | $2,692 | $21,724 | $3,802 | $17,922 |
| 2020 | $2,592 | $20,907 | $3,455 | $17,452 |
| 2019 | $2,437 | $19,550 | $3,004 | $16,546 |
| 2018 | $2,233 | $17,814 | $2,729 | $15,085 |
| 2017 | $1,990 | $15,744 | $2,729 | $13,015 |
| 2016 | $1,786 | $14,525 | $2,729 | $11,796 |
| 2015 | $1,629 | $13,283 | $2,729 | $10,554 |
| 2013 | -- | $11,397 | $2,481 | $8,916 |
Source: Public Records
Map
Nearby Homes
- 507 W Park St
- 573 W Loula St
- 600 W Elm St
- 612 N Logan St
- 109 E Cedar St
- 619 N Walnut St
- 631 N Willie St
- 336 E Park St
- 335 S Water St
- 617 S Grant St
- 401 S Harrison St
- 397 W Johnston St
- 501 E Spruce St
- 812 S Troost St
- 1425 W Poplar St
- 1106 W Sheridan St
- 706 S Kansas Ave
- 1545 W Park St
- 321 S Wabash Cir
- 540 W Northview St
- 108 N Logan St
- 562 W Park St
- 110 N Logan St
- 550 W Park St
- 112 N Logan St
- 572 W Park St
- 542 W Park St
- 569 W Park St
- 561 W Park St
- 561 & 563 W Park St
- 553 W Park St
- 567 W Park St
- 545 W Park St
- 528 W Park St
- 541 W Park St
- 526 W Park St
- 708 W Santa fe St
- 204 N Logan St
- 706 W Santa fe St
- 704 W Santa fe St