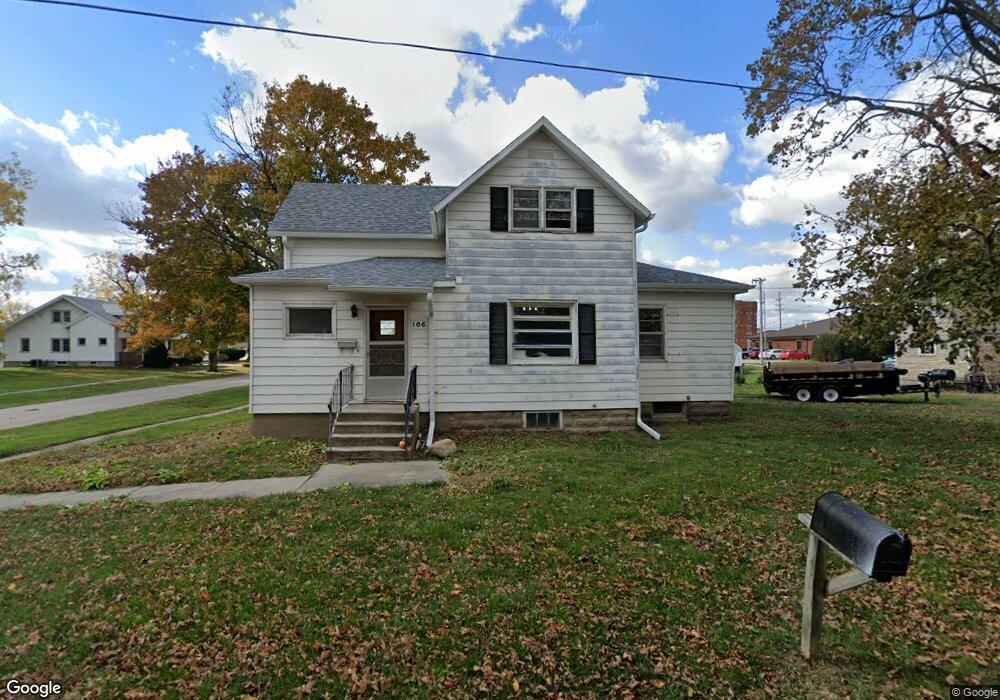
106 S 6th St Montezuma, IA 50171
Estimated Value: $115,668 - $256,000
3
Beds
4
Baths
1,356
Sq Ft
$117/Sq Ft
Est. Value
About This Home
This home is located at 106 S 6th St, Montezuma, IA 50171 and is currently estimated at $158,917, approximately $117 per square foot. 106 S 6th St is a home located in Poweshiek County with nearby schools including Montezuma Elementary School and Montezuma Junior High School.
Ownership History
Date
Name
Owned For
Owner Type
Purchase Details
Closed on
Dec 20, 2019
Sold by
Erselius Andrew G and Erselius Sara E
Bought by
Tompkins Lyle J and Thompkins Mary
Current Estimated Value
Home Financials for this Owner
Home Financials are based on the most recent Mortgage that was taken out on this home.
Original Mortgage
$25,000
Interest Rate
3.6%
Mortgage Type
Stand Alone Refi Refinance Of Original Loan
Purchase Details
Closed on
Jun 10, 2005
Sold by
Swanson Christine Anna and Goetze Duane A
Bought by
Moore Daniel G and Moore Deanna H
Home Financials for this Owner
Home Financials are based on the most recent Mortgage that was taken out on this home.
Original Mortgage
$68,000
Interest Rate
10.35%
Mortgage Type
Adjustable Rate Mortgage/ARM
Create a Home Valuation Report for This Property
The Home Valuation Report is an in-depth analysis detailing your home's value as well as a comparison with similar homes in the area
Home Values in the Area
Average Home Value in this Area
Purchase History
| Date | Buyer | Sale Price | Title Company |
|---|---|---|---|
| Tompkins Lyle J | $25,000 | None Available | |
| Tompkins Lyle J | $25,000 | None Available | |
| Moore Daniel G | $68,000 | None Available |
Source: Public Records
Mortgage History
| Date | Status | Borrower | Loan Amount |
|---|---|---|---|
| Closed | Tompkins Lyle J | $25,000 | |
| Previous Owner | Moore Daniel G | $68,000 |
Source: Public Records
Tax History Compared to Growth
Tax History
| Year | Tax Paid | Tax Assessment Tax Assessment Total Assessment is a certain percentage of the fair market value that is determined by local assessors to be the total taxable value of land and additions on the property. | Land | Improvement |
|---|---|---|---|---|
| 2025 | $700 | $73,290 | $14,260 | $59,030 |
| 2024 | $740 | $47,710 | $12,670 | $35,040 |
| 2023 | $784 | $47,710 | $12,670 | $35,040 |
| 2022 | $766 | $41,860 | $10,070 | $31,790 |
| 2021 | $766 | $39,490 | $9,500 | $29,990 |
| 2020 | $930 | $39,490 | $9,500 | $29,990 |
| 2019 | $964 | $58,020 | $9,500 | $48,520 |
| 2018 | $948 | $58,020 | $9,500 | $48,520 |
| 2017 | $916 | $58,020 | $9,500 | $48,520 |
| 2016 | $942 | $58,020 | $9,500 | $48,520 |
| 2015 | $942 | $58,020 | $9,500 | $48,520 |
| 2014 | $934 | $58,020 | $9,500 | $48,520 |
Source: Public Records
Map
Nearby Homes