Estimated Value: $232,000 - $332,585
Studio
3
Baths
1,010
Sq Ft
$293/Sq Ft
Est. Value
About This Home
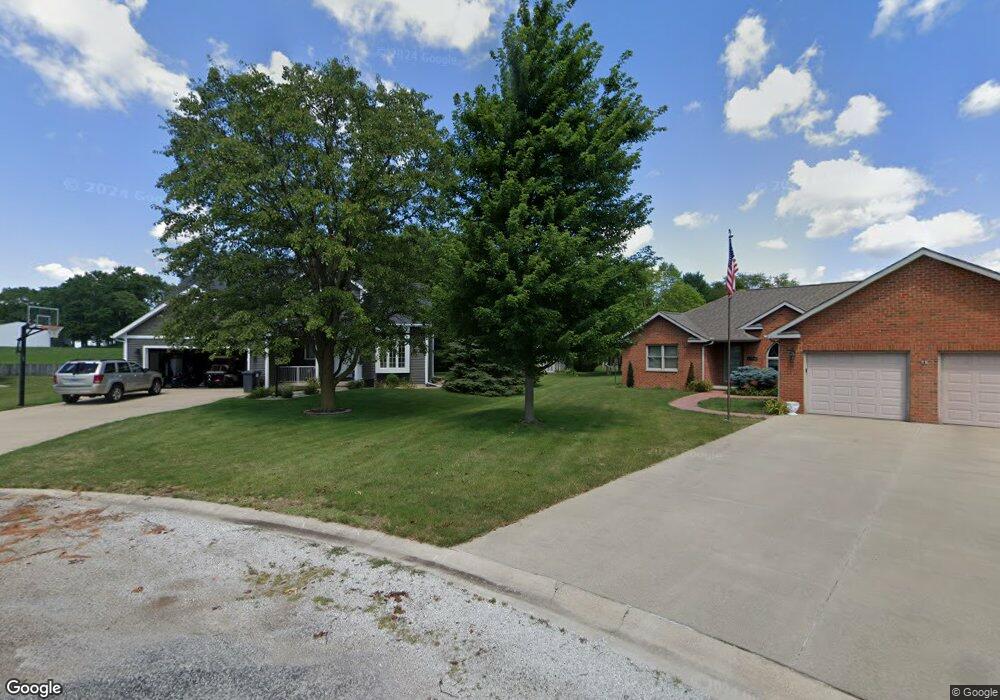
This home is located at 106 South Pointe Ct, Philo, IL 61864 and is currently estimated at $295,646, approximately $292 per square foot. 106 South Pointe Ct is a home located in Champaign County with nearby schools including Unity High School and St. Thomas Catholic Elementary School.
Ownership History
Date
Name
Owned For
Owner Type
Purchase Details
Closed on
Nov 28, 2018
Sold by
Dehart Zachary J and Adkins Jill E
Bought by
Puckett Alex and Puckett Summer
Current Estimated Value
Home Financials for this Owner
Home Financials are based on the most recent Mortgage that was taken out on this home.
Original Mortgage
$75,000
Outstanding Balance
$44,572
Interest Rate
4.8%
Mortgage Type
New Conventional
Estimated Equity
$251,074
Purchase Details
Closed on
May 23, 2008
Sold by
Oneill Brent E and Oneill Tamara L
Bought by
Dehart Zachary J and Adkins Jill E
Home Financials for this Owner
Home Financials are based on the most recent Mortgage that was taken out on this home.
Original Mortgage
$159,300
Interest Rate
5.93%
Mortgage Type
Purchase Money Mortgage
Create a Home Valuation Report for This Property
The Home Valuation Report is an in-depth analysis detailing your home's value as well as a comparison with similar homes in the area
Purchase History
We collect this data history from publicly available records. To have your information removed, we recommend requesting removal directly through your county’s website.
| Date | Buyer | Sale Price | Title Company |
|---|---|---|---|
| Puckett Alex | $200,000 | Attorney | |
| Dehart Zachary J | $177,000 | Central Illinois Land Title |
Source: Public Records
Mortgage History
We collect this data history from publicly available records. To have your information removed, we recommend requesting removal directly through your county’s website.
| Date | Status | Borrower | Loan Amount |
|---|---|---|---|
| Open | Puckett Alex | $75,000 | |
| Previous Owner | Dehart Zachary J | $159,300 |
Source: Public Records
Tax History
| Year | Tax Paid | Tax Assessment Tax Assessment Total Assessment is a certain percentage of the fair market value that is determined by local assessors to be the total taxable value of land and additions on the property. | Land | Improvement |
|---|---|---|---|---|
| 2025 | $5,477 | $106,340 | $23,540 | $82,800 |
| 2024 | $5,222 | $97,740 | $21,640 | $76,100 |
| 2023 | $5,222 | $90,590 | $20,060 | $70,530 |
| 2022 | $5,023 | $85,070 | $18,840 | $66,230 |
| 2021 | $4,817 | $80,790 | $17,890 | $62,900 |
| 2020 | $4,777 | $79,050 | $17,500 | $61,550 |
| 2019 | $4,990 | $75,650 | $16,750 | $58,900 |
| 2018 | $4,760 | $73,090 | $16,180 | $56,910 |
| 2017 | $4,748 | $69,540 | $15,390 | $54,150 |
| 2016 | $4,630 | $66,930 | $14,810 | $52,120 |
| 2015 | $4,590 | $65,230 | $14,430 | $50,800 |
| 2014 | $4,506 | $64,010 | $14,160 | $49,850 |
| 2013 | $4,541 | $64,010 | $14,160 | $49,850 |
Source: Public Records
Map
Nearby Homes
- 5 Truman Ct
- 1681 County Road 700 N
- 1980 County Road 900 N
- 413 W Main St
- 809 S Scarborough St
- 106 S Eldorado St
- 407 S Washington St
- 1081 County Road 1200 E
- 703 E Washington St
- 1971 County Road 1200 N
- 3207 Douglas Woods Dr
- 3504 S Myra Ridge Dr
- 1709 E Horizon Ln
- 506 Silver Lake Ct
- 405 E Larmon St
- 408 E Benham St
- 403 E Larmon St
- 3503 S Deer Ridge Dr
- 215 E Reynolds St
- 1711 E Lexington Dr
- 104 South Pointe Ct
- 105 South Pointe Ct
- 103 South Pointe Ct
- 507 S Harrison St
- 603 S Harrison St
- 102 South Pointe Ct
- 509 S Jackson St
- 605 S Harrison St
- 510 S Harrison St
- 504 S Jackson St
- 508 S Harrison St
- 604 S Lincoln St
- 105 Mckinley Cir
- 602 S Harrison St
- 104 W Stahl Dr
- 604 S Harrison St
- 502 S Jackson St
- 607 S Harrison St
- 507 S Adams St
- 606 S Harrison St
Your Personal Tour Guide
Ask me questions while you tour the home.