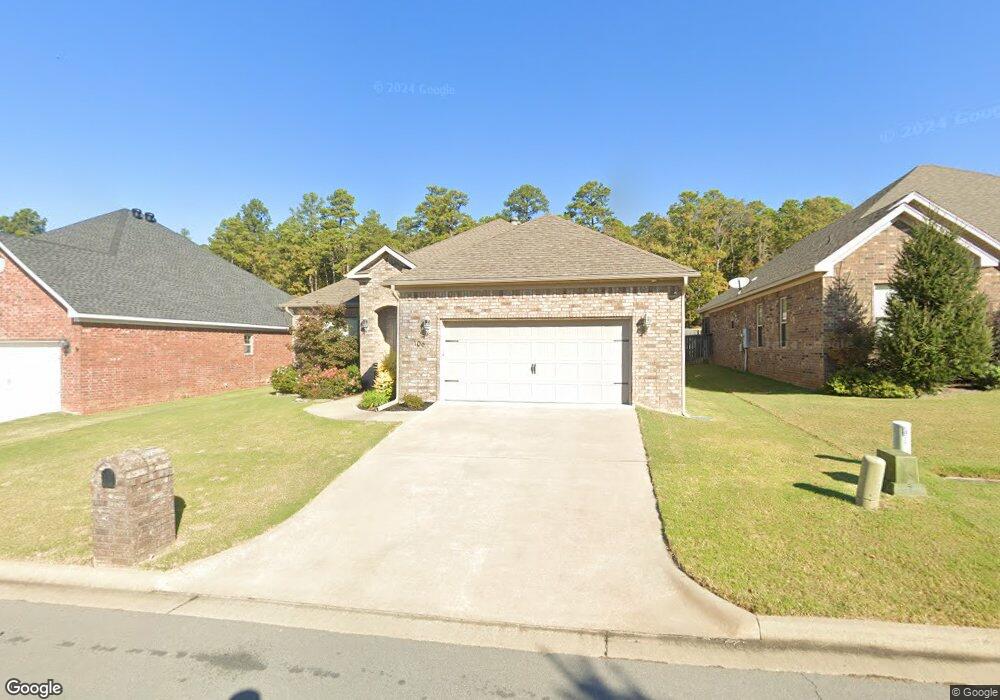
106 Valley Ranch Way Little Rock, AR 72223
Valley Ranch NeighborhoodEstimated Value: $373,000 - $414,000
3
Beds
2
Baths
2,095
Sq Ft
$185/Sq Ft
Est. Value
About This Home
This home is located at 106 Valley Ranch Way, Little Rock, AR 72223 and is currently estimated at $388,192, approximately $185 per square foot. 106 Valley Ranch Way is a home located in Pulaski County with nearby schools including Joe T. Robinson Elementary School, Joe T. Robinson Middle School, and Joe T. Robinson High School.
Ownership History
Date
Name
Owned For
Owner Type
Purchase Details
Closed on
Apr 14, 2016
Sold by
Bullard P Ellen
Bought by
Moore William Lee
Current Estimated Value
Home Financials for this Owner
Home Financials are based on the most recent Mortgage that was taken out on this home.
Original Mortgage
$232,000
Outstanding Balance
$184,068
Interest Rate
3.64%
Mortgage Type
New Conventional
Estimated Equity
$204,124
Purchase Details
Closed on
Feb 5, 2015
Sold by
Norman Matthew Dale
Bought by
Bullard P Ellen and The Matthew Dale Norman Trust
Purchase Details
Closed on
May 27, 2014
Sold by
Jim Pace Homes Llc
Bought by
Norman Matthew Dale
Purchase Details
Closed on
Dec 4, 2013
Sold by
C J Pace Construction Llc
Bought by
Jim Pace Homes Llc
Home Financials for this Owner
Home Financials are based on the most recent Mortgage that was taken out on this home.
Original Mortgage
$209,600
Interest Rate
4.14%
Mortgage Type
Construction
Create a Home Valuation Report for This Property
The Home Valuation Report is an in-depth analysis detailing your home's value as well as a comparison with similar homes in the area
Home Values in the Area
Average Home Value in this Area
Purchase History
| Date | Buyer | Sale Price | Title Company |
|---|---|---|---|
| Moore William Lee | $262,000 | Pulaski County Title | |
| Bullard P Ellen | -- | None Available | |
| Norman Matthew Dale | $258,000 | American Abstract & Title Co | |
| Jim Pace Homes Llc | -- | American Abstract & Title Co |
Source: Public Records
Mortgage History
| Date | Status | Borrower | Loan Amount |
|---|---|---|---|
| Open | Moore William Lee | $232,000 | |
| Previous Owner | Jim Pace Homes Llc | $209,600 |
Source: Public Records
Tax History Compared to Growth
Tax History
| Year | Tax Paid | Tax Assessment Tax Assessment Total Assessment is a certain percentage of the fair market value that is determined by local assessors to be the total taxable value of land and additions on the property. | Land | Improvement |
|---|---|---|---|---|
| 2025 | $3,842 | $61,745 | $11,600 | $50,145 |
| 2024 | $3,522 | $61,745 | $11,600 | $50,145 |
| 2023 | $3,522 | $61,745 | $11,600 | $50,145 |
| 2022 | $3,362 | $61,745 | $11,600 | $50,145 |
| 2021 | $3,226 | $49,790 | $12,000 | $37,790 |
| 2020 | $2,827 | $49,790 | $12,000 | $37,790 |
| 2019 | $3,202 | $49,790 | $12,000 | $37,790 |
| 2018 | $3,202 | $49,790 | $12,000 | $37,790 |
| 2017 | $3,202 | $49,790 | $12,000 | $37,790 |
| 2016 | $3,030 | $52,560 | $11,000 | $41,560 |
| 2015 | $713 | $11,000 | $11,000 | $0 |
| 2014 | $713 | $11,000 | $11,000 | $0 |
Source: Public Records
Map
Nearby Homes
- 5 Mountain Brook Rd
- 424 Valley Ranch Cir
- 16 Mountain Brook Rd
- 429 Valley Ranch Cir
- 20 Mountain Brook Rd
- 425 Valley Ranch Cir
- 0142 Valley Ranch Dr
- 18021 Cantrell Rd
- 12 Cobblestone Way
- 31 Rosaires Way
- 9 Bishop Place
- 19 Bishop Place
- 14 Aberdeen Dr
- 44 Durance Dr
- 8804 Ranch Blvd
- 96 Ranch Ridge Rd
- 16912 Cantrell Rd
- 22 Margeaux Dr
- 21 Longleaf Ln
- 32 Valletta Cir
- 108 Valley Ranch Way
- 104 Valley Ranch Way
- 110 Valley Ranch Way
- 102 Valley Ranch Way
- 109 Valley Ranch Way
- 107 Valley Ranch Way
- 111 Valley Ranch Way
- 100 Valley Ranch Way
- 0 Valley Ranch Way
- 105 Valley Ranch Way
- 112 Valley Ranch Way
- 115 Valley Ranch Way
- 103 Valley Ranch Way
- 101 Valley Ranch Way
- 114 Valley Ranch Way
- 10 Landry Ln
- 12 Landry Ln
- 8 Landry Ln
- 14 Landry Ln
- 116 Valley Ranch Way