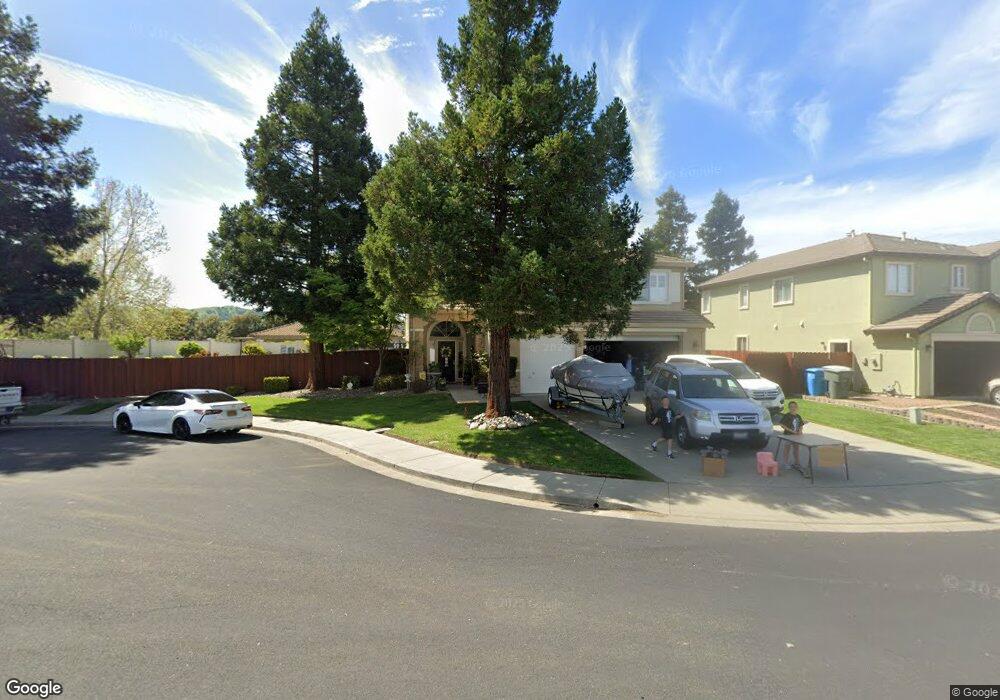
1060 Copper Ct Vacaville, CA 95687
Estimated Value: $699,000 - $720,984
4
Beds
3
Baths
2,310
Sq Ft
$309/Sq Ft
Est. Value
About This Home
This home is located at 1060 Copper Ct, Vacaville, CA 95687 and is currently estimated at $714,496, approximately $309 per square foot. 1060 Copper Ct is a home located in Solano County with nearby schools including Cambridge Elementary School, Golden West Middle School, and Vanden High School.
Ownership History
Date
Name
Owned For
Owner Type
Purchase Details
Closed on
Jul 23, 2025
Sold by
Tiscareno Michael E and Tiscareno Graziella A
Bought by
Michael And Graziella Tiscareno Living Trust and Tiscareno
Current Estimated Value
Purchase Details
Closed on
Mar 10, 1999
Sold by
Ratti Kenneth J and Ratti Jamie S
Bought by
Tiscarenol Michael E and Tiscareno Graziella A
Home Financials for this Owner
Home Financials are based on the most recent Mortgage that was taken out on this home.
Original Mortgage
$240,000
Interest Rate
6.73%
Purchase Details
Closed on
Sep 18, 1995
Sold by
Lewis Homes Vacaville I
Bought by
Ratti Kenneth J and Ratti Jamie S
Home Financials for this Owner
Home Financials are based on the most recent Mortgage that was taken out on this home.
Original Mortgage
$160,000
Interest Rate
7.97%
Purchase Details
Closed on
Jul 18, 1995
Sold by
Ratti Dorothy L
Bought by
Ratti Kenneth John and Ratti Jamie Sue
Create a Home Valuation Report for This Property
The Home Valuation Report is an in-depth analysis detailing your home's value as well as a comparison with similar homes in the area
Purchase History
| Date | Buyer | Sale Price | Title Company |
|---|---|---|---|
| Michael And Graziella Tiscareno Living Trust | -- | None Listed On Document | |
| Tiscarenol Michael E | $254,000 | Frontier Title Company | |
| Ratti Kenneth J | $223,000 | First American Title Guarant | |
| Ratti Kenneth John | $30,000 | North American Title Co |
Source: Public Records
Mortgage History
| Date | Status | Borrower | Loan Amount |
|---|---|---|---|
| Previous Owner | Tiscarenol Michael E | $240,000 | |
| Previous Owner | Ratti Kenneth J | $160,000 |
Source: Public Records
Tax History
| Year | Tax Paid | Tax Assessment Tax Assessment Total Assessment is a certain percentage of the fair market value that is determined by local assessors to be the total taxable value of land and additions on the property. | Land | Improvement |
|---|---|---|---|---|
| 2025 | $5,482 | $398,979 | $78,380 | $320,599 |
| 2024 | $5,482 | $391,157 | $76,844 | $314,313 |
| 2023 | $5,355 | $383,488 | $75,338 | $308,150 |
| 2022 | $5,237 | $375,969 | $73,861 | $302,108 |
| 2021 | $5,110 | $368,598 | $72,413 | $296,185 |
| 2020 | $5,055 | $364,819 | $71,671 | $293,148 |
| 2019 | $4,976 | $357,666 | $70,266 | $287,400 |
| 2018 | $4,916 | $350,654 | $68,889 | $281,765 |
| 2017 | $4,782 | $343,780 | $67,539 | $276,241 |
| 2016 | $4,728 | $337,040 | $66,215 | $270,825 |
| 2015 | $4,667 | $331,978 | $65,221 | $266,757 |
| 2014 | $4,597 | $325,476 | $63,944 | $261,532 |
Source: Public Records
Map
Nearby Homes
- 897 Sapphire Cir
- 967 Copper Way
- 3007 Norwich Ct
- 1007 Canterbury Ct
- 805 Broadfork Cir
- 954 Iron Dr
- 448 Potters Ln
- 196 Somerville Dr
- 7079 Westminster Ct
- 531 Colonial Cir
- 250 Somerville Dr
- 100 Mechanic Ln
- 2361 Newcastle Dr
- 107 Mechanic Ln
- 556 Somerville Cir
- 766 Calico Trail
- 821 Saddle Horn Trail
- 437 Jerrylee Rd
- 4007 Drafter Ct
- 4007 Mansfield St
Your Personal Tour Guide
Ask me questions while you tour the home.