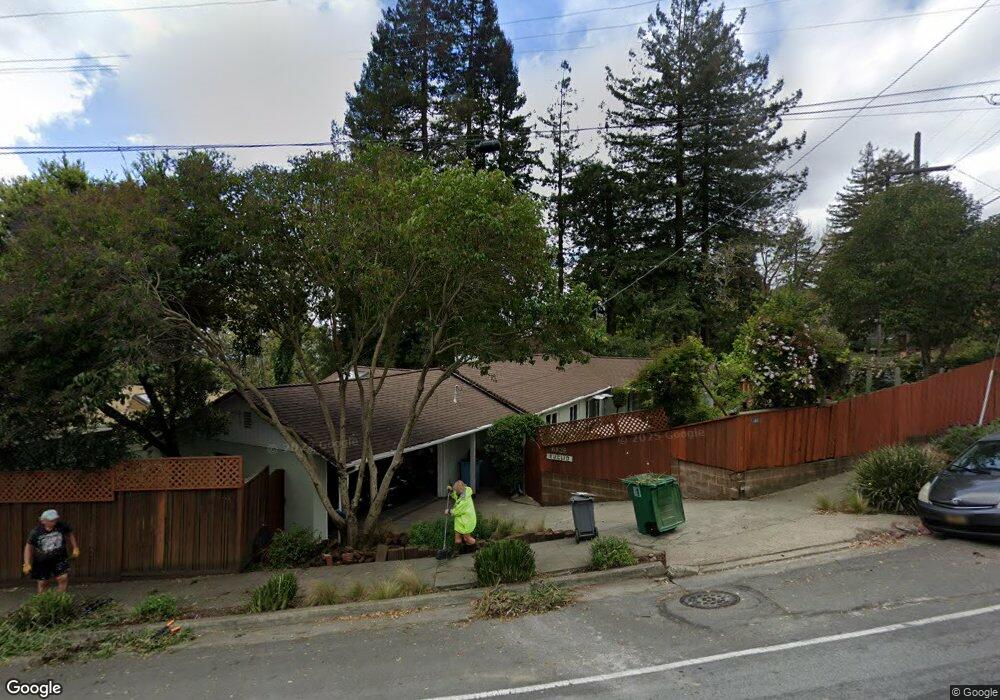
1060 Euclid Ave Berkeley, CA 94708
Berkeley Hills NeighborhoodEstimated Value: $1,290,000 - $1,532,000
3
Beds
2
Baths
1,496
Sq Ft
$971/Sq Ft
Est. Value
About This Home
This home is located at 1060 Euclid Ave, Berkeley, CA 94708 and is currently estimated at $1,452,749, approximately $971 per square foot. 1060 Euclid Ave is a home located in Alameda County with nearby schools including Cragmont Elementary School, Berkeley Arts Magnet at Whittier School, and Washington Elementary School.
Ownership History
Date
Name
Owned For
Owner Type
Purchase Details
Closed on
Jun 17, 2015
Sold by
Harland Michael
Bought by
The Michael Harland & Denise Harland Rev
Current Estimated Value
Purchase Details
Closed on
May 20, 2002
Sold by
Harland Denise K
Bought by
Harland Michael
Home Financials for this Owner
Home Financials are based on the most recent Mortgage that was taken out on this home.
Original Mortgage
$275,000
Outstanding Balance
$111,534
Interest Rate
6.37%
Estimated Equity
$1,341,215
Create a Home Valuation Report for This Property
The Home Valuation Report is an in-depth analysis detailing your home's value as well as a comparison with similar homes in the area
Home Values in the Area
Average Home Value in this Area
Purchase History
| Date | Buyer | Sale Price | Title Company |
|---|---|---|---|
| The Michael Harland & Denise Harland Rev | -- | None Available | |
| Harland Michael | -- | Old Republic Title Company | |
| Harland Michael | $500,000 | Old Republic Title Company |
Source: Public Records
Mortgage History
| Date | Status | Borrower | Loan Amount |
|---|---|---|---|
| Open | Harland Michael | $275,000 |
Source: Public Records
Tax History
| Year | Tax Paid | Tax Assessment Tax Assessment Total Assessment is a certain percentage of the fair market value that is determined by local assessors to be the total taxable value of land and additions on the property. | Land | Improvement |
|---|---|---|---|---|
| 2025 | $10,910 | $731,600 | $221,580 | $517,020 |
| 2024 | $10,910 | $717,120 | $217,236 | $506,884 |
| 2023 | $10,683 | $709,924 | $212,977 | $496,947 |
| 2022 | $10,499 | $689,004 | $208,801 | $487,203 |
| 2021 | $10,525 | $675,360 | $204,708 | $477,652 |
| 2020 | $10,005 | $675,364 | $202,609 | $472,755 |
| 2019 | $9,655 | $662,124 | $198,637 | $463,487 |
| 2018 | $9,497 | $649,144 | $194,743 | $454,401 |
| 2017 | $9,147 | $636,420 | $190,926 | $445,494 |
| 2016 | $8,880 | $623,944 | $187,183 | $436,761 |
| 2015 | $8,764 | $614,574 | $184,372 | $430,202 |
| 2014 | $8,663 | $602,540 | $180,762 | $421,778 |
Source: Public Records
Map
Nearby Homes
- 1106 Cragmont Ave
- 962 Regal Rd
- 1004 Cragmont Ave
- 1165 Cragmont Ave
- 938 San Benito Rd
- 2315 Eunice St
- 1024 Grizzly Peak Blvd
- 1110 Sterling Ave
- 1155 Keeler Ave
- 1085 Creston Rd
- 1160 Miller Ave
- 935 Grizzly Peak Blvd
- 2686 Shasta Rd
- 2121 Eunice St
- 777 Cragmont Ave
- 2501 Rose Walk
- 758 Spruce St
- 813 San Diego Rd
- 1221 Grizzly Peak Blvd
- 730 Wildcat Canyon Rd
- 1076 Euclid Ave
- 1066 Keith Ave
- 1056 Euclid Ave
- 1080 Euclid Ave
- 1064 Keith Ave
- 1052 Euclid Ave
- 1067 Keith Ave
- 1059 Euclid Ave
- 1084 Euclid Ave
- 1063 Euclid Ave
- 1060 Keith Ave
- 1065 Keith Ave
- 1053 Euclid Ave
- 1071 Euclid Ave
- 1044 Euclid Ave
- 1073 Euclid Ave
- 1088 Euclid Ave
- 1075 Keith Ave
- 1061 Keith Ave
- 1032 Cragmont Ave
Your Personal Tour Guide
Ask me questions while you tour the home.