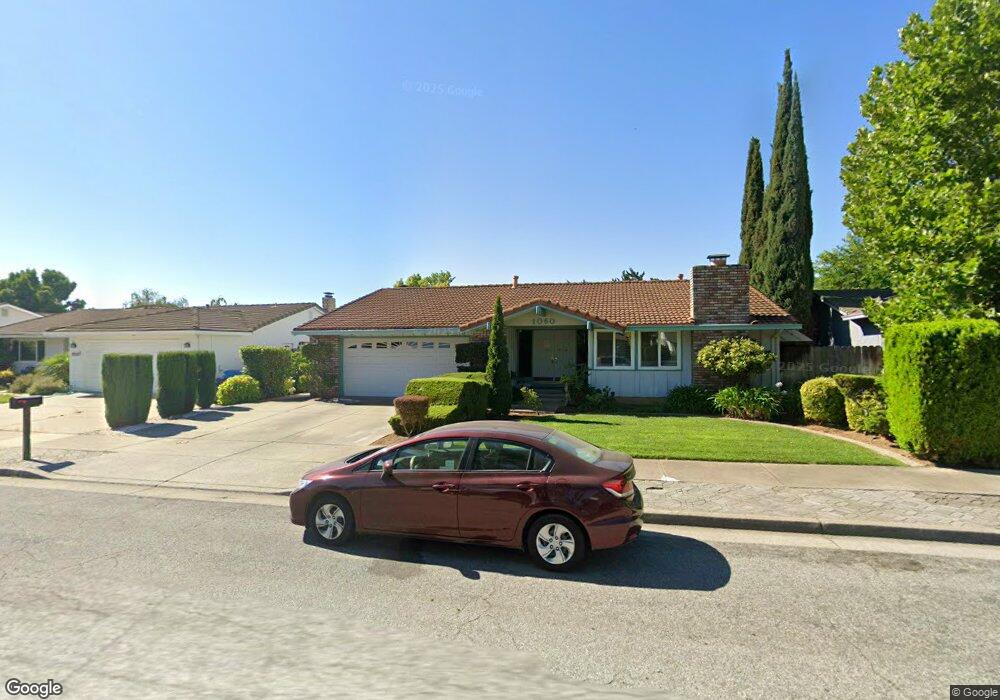
1060 Ortega Cir Unit 8 Gilroy, CA 95020
Estimated Value: $928,178 - $1,071,000
4
Beds
2
Baths
1,839
Sq Ft
$542/Sq Ft
Est. Value
About This Home
This home is located at 1060 Ortega Cir Unit 8, Gilroy, CA 95020 and is currently estimated at $997,295, approximately $542 per square foot. 1060 Ortega Cir Unit 8 is a home located in Santa Clara County with nearby schools including El Roble Elementary School, Brownell Middle School, and Solorsano Middle School.
Ownership History
Date
Name
Owned For
Owner Type
Purchase Details
Closed on
Feb 29, 2012
Sold by
Gharakhanian Candice and Gharakhanian James
Bought by
Gharakhanian James Randall and Gharakhanian Candice Dianne
Current Estimated Value
Purchase Details
Closed on
Oct 8, 2004
Sold by
Deal Robert and Louise Deal T
Bought by
Gharakhanian James and Gharakhanian Candice
Home Financials for this Owner
Home Financials are based on the most recent Mortgage that was taken out on this home.
Original Mortgage
$436,500
Outstanding Balance
$215,452
Interest Rate
5.72%
Mortgage Type
Stand Alone First
Estimated Equity
$781,843
Purchase Details
Closed on
May 29, 1995
Sold by
Deal Robert Henry and Louise Deal T
Bought by
Deal Robert and Louise Deal T
Create a Home Valuation Report for This Property
The Home Valuation Report is an in-depth analysis detailing your home's value as well as a comparison with similar homes in the area
Home Values in the Area
Average Home Value in this Area
Purchase History
| Date | Buyer | Sale Price | Title Company |
|---|---|---|---|
| Gharakhanian James Randall | -- | None Available | |
| Gharakhanian James | $582,000 | Chicago Title | |
| Deal Robert | -- | -- |
Source: Public Records
Mortgage History
| Date | Status | Borrower | Loan Amount |
|---|---|---|---|
| Open | Gharakhanian James | $436,500 | |
| Closed | Gharakhanian James | $87,300 |
Source: Public Records
Tax History
| Year | Tax Paid | Tax Assessment Tax Assessment Total Assessment is a certain percentage of the fair market value that is determined by local assessors to be the total taxable value of land and additions on the property. | Land | Improvement |
|---|---|---|---|---|
| 2025 | $9,865 | $810,888 | $445,903 | $364,985 |
| 2024 | $9,865 | $794,989 | $437,160 | $357,829 |
| 2023 | $9,808 | $779,402 | $428,589 | $350,813 |
| 2022 | $9,648 | $764,121 | $420,186 | $343,935 |
| 2021 | $9,606 | $749,140 | $411,948 | $337,192 |
| 2020 | $14,174 | $741,459 | $407,724 | $333,735 |
| 2019 | $14,074 | $726,922 | $399,730 | $327,192 |
| 2018 | $13,450 | $712,670 | $391,893 | $320,777 |
| 2017 | $13,121 | $658,000 | $361,800 | $296,200 |
| 2016 | $12,571 | $615,000 | $315,000 | $300,000 |
| 2015 | $6,567 | $532,000 | $292,500 | $239,500 |
| 2014 | $6,445 | $515,000 | $283,200 | $231,800 |
Source: Public Records
Map
Nearby Homes
- 7609 Santa Paula Dr
- 1250 Driftwood Terrace
- 1330 Redwood Ln
- 1231 Juniper Dr Unit H
- 7821 Santa Theresa Dr
- 730 Tennyson Dr
- 7969 Kipling Cir
- 704 Tennyson Dr
- 7902 English Oak Cir
- 7942 English Oak Cir
- 8170 Westwood Dr Unit 22
- 925 Blake Ct
- 7490 Santa Theresa Dr Unit 10
- 1008 Primrose Ln
- 760 Welburn Ave
- 60 Monte Vista Way
- 7460 Miller Ave
- 626 Broadway
- 622 Broadway
- 620 Broadway
- 1070 Ortega Cir
- 1050 Ortega Cir
- 1125 Hacienda Dr
- 1115 Hacienda Dr Unit 6
- 1080 Ortega Cir
- 1040 Ortega Cir
- 1135 Hacienda Dr
- 1105 Hacienda Dr
- 1065 Ortega Cir
- 1075 Ortega Cir
- 1055 Ortega Cir
- 1145 Hacienda Dr
- 1090 Ortega Cir
- 1030 Ortega Cir
- 1085 Ortega Cir
- 1095 Hacienda Dr
- 1045 Ortega Cir
- 1155 Hacienda Dr
- 1095 Ortega Cir Unit 8
- 1100 Ortega Cir
Your Personal Tour Guide
Ask me questions while you tour the home.