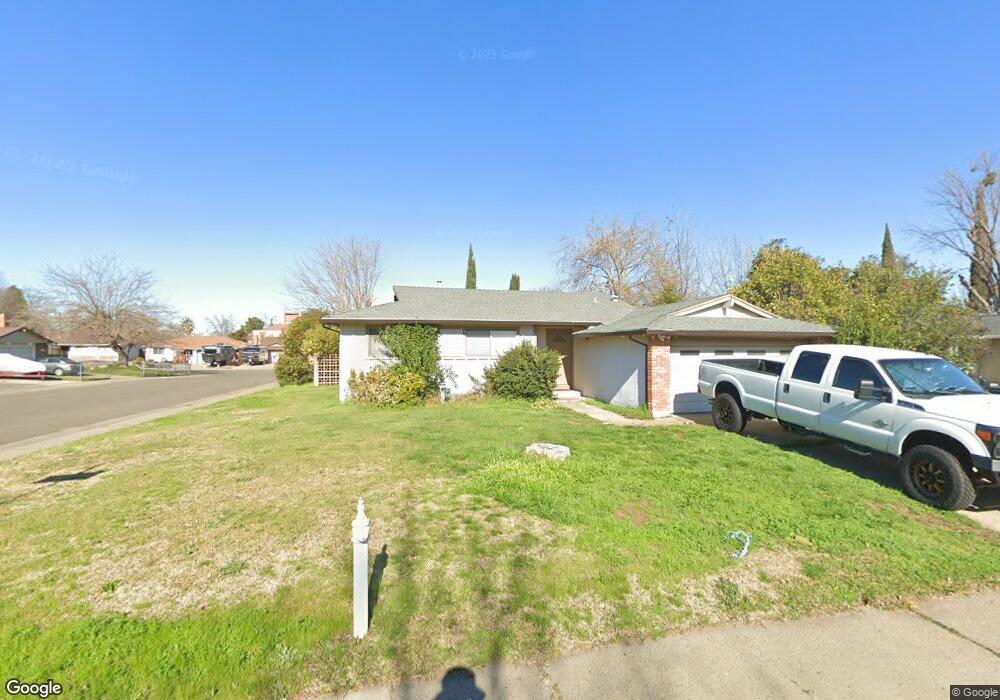
10601 Viani Way Rancho Cordova, CA 95670
Cordova Lane NeighborhoodEstimated Value: $432,393 - $467,000
3
Beds
2
Baths
1,220
Sq Ft
$370/Sq Ft
Est. Value
About This Home
This home is located at 10601 Viani Way, Rancho Cordova, CA 95670 and is currently estimated at $451,598, approximately $370 per square foot. 10601 Viani Way is a home located in Sacramento County with nearby schools including Williamson Elementary School, W.E. Mitchell Middle School, and Cordova High School.
Ownership History
Date
Name
Owned For
Owner Type
Purchase Details
Closed on
Nov 9, 2013
Sold by
Thr California Lp
Bought by
2013 1 Ih Borrower Lp
Current Estimated Value
Home Financials for this Owner
Home Financials are based on the most recent Mortgage that was taken out on this home.
Original Mortgage
$479,137,000
Outstanding Balance
$357,316,219
Interest Rate
4.23%
Mortgage Type
Purchase Money Mortgage
Estimated Equity
-$356,864,621
Purchase Details
Closed on
Oct 31, 2012
Sold by
Mcmann Mark A and Mc Mann Sheri A
Bought by
Thr California Lp
Purchase Details
Closed on
Feb 23, 1994
Sold by
Mcintire Donald L and Mcintire Doris M
Bought by
Mcmann Mark A and Mcmann Sheri A
Home Financials for this Owner
Home Financials are based on the most recent Mortgage that was taken out on this home.
Original Mortgage
$114,792
Interest Rate
7.09%
Mortgage Type
FHA
Create a Home Valuation Report for This Property
The Home Valuation Report is an in-depth analysis detailing your home's value as well as a comparison with similar homes in the area
Home Values in the Area
Average Home Value in this Area
Purchase History
| Date | Buyer | Sale Price | Title Company |
|---|---|---|---|
| 2013 1 Ih Borrower Lp | -- | None Available | |
| Thr California Lp | $133,000 | None Available | |
| Mcmann Mark A | $115,000 | American Title Insurance Co |
Source: Public Records
Mortgage History
| Date | Status | Borrower | Loan Amount |
|---|---|---|---|
| Open | 2013 1 Ih Borrower Lp | $479,137,000 | |
| Previous Owner | Mcmann Mark A | $114,792 |
Source: Public Records
Tax History Compared to Growth
Tax History
| Year | Tax Paid | Tax Assessment Tax Assessment Total Assessment is a certain percentage of the fair market value that is determined by local assessors to be the total taxable value of land and additions on the property. | Land | Improvement |
|---|---|---|---|---|
| 2025 | $3,555 | $301,745 | $104,449 | $197,296 |
| 2024 | $3,555 | $295,829 | $102,401 | $193,428 |
| 2023 | $3,485 | $290,030 | $100,394 | $189,636 |
| 2022 | $3,442 | $284,344 | $98,426 | $185,918 |
| 2021 | $3,375 | $278,770 | $96,497 | $182,273 |
| 2020 | $3,354 | $275,913 | $95,508 | $180,405 |
| 2019 | $3,301 | $270,504 | $93,636 | $176,868 |
| 2018 | $1,698 | $136,360 | $34,197 | $102,163 |
| 2017 | $1,656 | $133,687 | $33,527 | $100,160 |
| 2016 | $1,609 | $131,067 | $32,870 | $98,197 |
| 2015 | $1,528 | $129,099 | $32,377 | $96,722 |
| 2014 | $1,627 | $126,571 | $31,743 | $94,828 |
Source: Public Records
Map
Nearby Homes
- 2413 Cordova Ln
- 2329 Mcgregor Dr
- 10583 Home Ranch Ct
- 2404 Coolidge Way
- 10825 Walnutwood Way
- 2352 Sonata Dr
- 10465 Rugby Ct
- 2129 Danbury Way
- 2337 Benita Dr
- 2256 Ramo Ct
- 10835 Coloma Rd Unit 3
- 2255 El Manto Dr
- 2171 River Vista Way
- 1977 Benita Dr Unit 1
- 2701 Zinfandel Dr
- 2266 River Trails Cir
- 2200 Kimwood Ln
- 1920 Benita Dr
- 10872 Oakton Way
- 2746 Aramon Dr
- 10607 Viani Way
- 10624 Audubon Way
- 10628 Audubon Way
- 10613 Viani Way
- 2340 Glenfaire Dr
- 2336 Glenfaire Dr
- 10600 Viani Way
- 10606 Viani Way
- 10632 Audubon Way
- 2332 Glenfaire Dr
- 10612 Viani Way
- 10617 Viani Way
- 2348 Glenfaire Dr
- 10636 Audubon Way
- 10616 Viani Way
- 2401 Glenfaire Dr
- 2352 Glenfaire Dr
- 2357 Cordova Ln
- 10621 Viani Way
- 2361 Cordova Ln