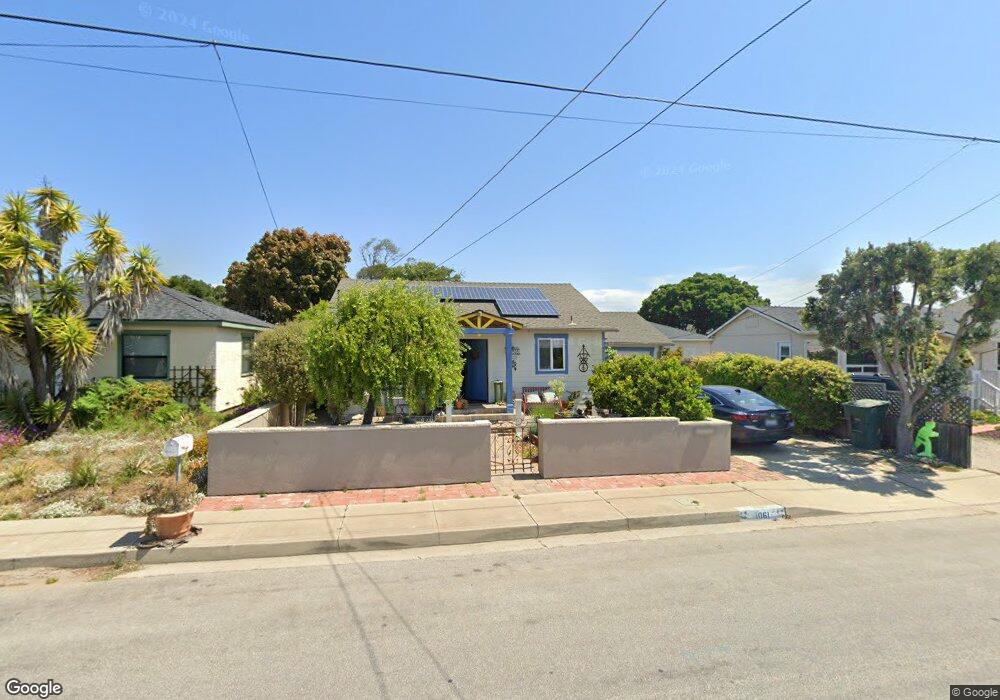
1061 Ritchie Rd Grover Beach, CA 93433
Estimated Value: $669,845 - $788,000
2
Beds
2
Baths
1,294
Sq Ft
$564/Sq Ft
Est. Value
About This Home
This home is located at 1061 Ritchie Rd, Grover Beach, CA 93433 and is currently estimated at $730,461, approximately $564 per square foot. 1061 Ritchie Rd is a home located in San Luis Obispo County with nearby schools including Grover Heights Elementary School, Judkins Middle School, and Arroyo Grande High School.
Ownership History
Date
Name
Owned For
Owner Type
Purchase Details
Closed on
Oct 11, 2007
Sold by
Nielson Carol
Bought by
Nielson Carol
Current Estimated Value
Purchase Details
Closed on
Mar 28, 2001
Sold by
Welch Richard L and Welch Gari L
Bought by
Nielson Carol
Home Financials for this Owner
Home Financials are based on the most recent Mortgage that was taken out on this home.
Original Mortgage
$130,000
Outstanding Balance
$48,066
Interest Rate
7.06%
Mortgage Type
Stand Alone First
Estimated Equity
$682,395
Purchase Details
Closed on
Mar 5, 1998
Sold by
Welch Richard L and Welch Gari L
Bought by
Welch Richard L and Welch Gari L
Purchase Details
Closed on
Mar 10, 1994
Sold by
Walther William
Bought by
Walther Carol L Nielson
Create a Home Valuation Report for This Property
The Home Valuation Report is an in-depth analysis detailing your home's value as well as a comparison with similar homes in the area
Home Values in the Area
Average Home Value in this Area
Purchase History
| Date | Buyer | Sale Price | Title Company |
|---|---|---|---|
| Nielson Carol | -- | None Available | |
| Nielson Carol | -- | Fidelity National Title Co | |
| Welch Richard L | -- | -- | |
| Walther Carol L Nielson | -- | -- |
Source: Public Records
Mortgage History
| Date | Status | Borrower | Loan Amount |
|---|---|---|---|
| Open | Nielson Carol | $130,000 |
Source: Public Records
Tax History
| Year | Tax Paid | Tax Assessment Tax Assessment Total Assessment is a certain percentage of the fair market value that is determined by local assessors to be the total taxable value of land and additions on the property. | Land | Improvement |
|---|---|---|---|---|
| 2025 | $2,947 | $269,664 | $127,408 | $142,256 |
| 2024 | $2,923 | $264,377 | $124,910 | $139,467 |
| 2023 | $2,923 | $259,194 | $122,461 | $136,733 |
| 2022 | $2,876 | $254,112 | $120,060 | $134,052 |
| 2021 | $2,840 | $249,130 | $117,706 | $131,424 |
| 2020 | $2,807 | $246,577 | $116,500 | $130,077 |
| 2019 | $2,783 | $241,743 | $114,216 | $127,527 |
| 2018 | $2,746 | $237,004 | $111,977 | $125,027 |
| 2017 | $2,623 | $232,358 | $109,782 | $122,576 |
| 2016 | $2,443 | $227,803 | $107,630 | $120,173 |
| 2015 | $2,386 | $224,382 | $106,014 | $118,368 |
| 2014 | $2,247 | $219,988 | $103,938 | $116,050 |
Source: Public Records
Map
Nearby Homes
- 676 N 12th St
- 1134 Atlantic City Ave
- 850 N 12th St
- 604 Mira Mar Ct
- 451 N 13th St
- 691 Charles St
- 910 N 12th St
- 604 Ocean View Ave
- 573 N 16th St
- 261 N 13th St
- 1657 Newport Ave
- 172 N 13th St
- 417 Saratoga Ave
- 363 N 5th St
- 319 California 1 Unit 48
- 319 California 1 Unit 58
- 1477 W Grand Ave Unit 52
- 1477 W Grand Ave Unit 50
- 114 Village Cir
- 1370 W Grand Ave Unit 138
- 1073 Ritchie Rd
- 1055 Ritchie Rd
- 1113 Ritchie Rd
- 1043 Ritchie Rd
- 1043 Ritchie Rd
- 1043 Ritchie Rd
- 1125 Ritchie Rd
- 1137 Ritchie Rd
- 6 Angello Terrace
- 1072 Ritchie Rd
- 1112 Ritchie Rd
- 1033 Ritchie Rd
- 1042 Ritchie Rd
- 0 Ritchie Rd
- 4 Angello Terrace
- 1030 Ritchie Rd
- 1037 Ritchie Rd
- 1029 Ritchie Rd
- 125 Ritchie Ct
- 1153 Ritchie Rd
Your Personal Tour Guide
Ask me questions while you tour the home.