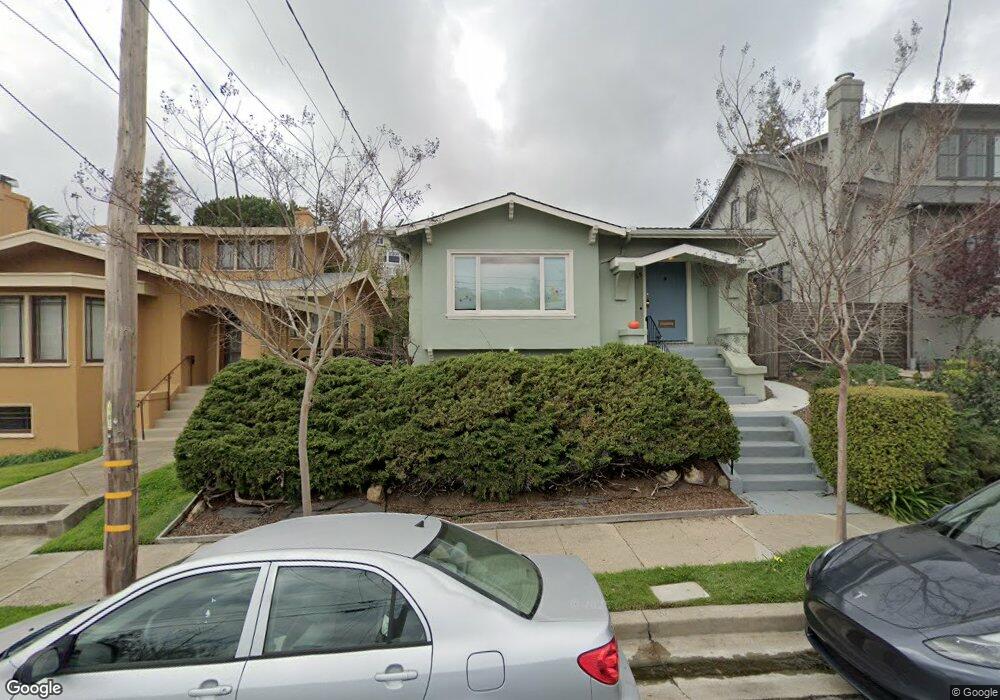
1063 Ranleigh Way Piedmont, CA 94610
Lakeshore NeighborhoodEstimated Value: $1,036,526 - $1,759,000
2
Beds
1
Bath
1,383
Sq Ft
$983/Sq Ft
Est. Value
About This Home
This home is located at 1063 Ranleigh Way, Piedmont, CA 94610 and is currently estimated at $1,358,882, approximately $982 per square foot. 1063 Ranleigh Way is a home located in Alameda County with nearby schools including Piedmont Middle School, Piedmont High School, and St. Paul's Episcopal School.
Ownership History
Date
Name
Owned For
Owner Type
Purchase Details
Closed on
Nov 20, 2020
Sold by
Preston John S and Preston Virginia Steeper
Bought by
Preston John S and Preston Virginia Steeper
Current Estimated Value
Home Financials for this Owner
Home Financials are based on the most recent Mortgage that was taken out on this home.
Original Mortgage
$195,000
Outstanding Balance
$173,522
Interest Rate
2.8%
Mortgage Type
New Conventional
Estimated Equity
$1,185,360
Purchase Details
Closed on
Jul 31, 2001
Sold by
Preston Virginia S and Preston John S
Bought by
Preston John S and Preston Virginia A
Home Financials for this Owner
Home Financials are based on the most recent Mortgage that was taken out on this home.
Original Mortgage
$275,000
Interest Rate
7.1%
Purchase Details
Closed on
Jun 20, 1996
Sold by
Martinez Manuel A and Lin Ann
Bought by
Preston John S and Preston Virginia S
Home Financials for this Owner
Home Financials are based on the most recent Mortgage that was taken out on this home.
Original Mortgage
$244,000
Interest Rate
7.12%
Create a Home Valuation Report for This Property
The Home Valuation Report is an in-depth analysis detailing your home's value as well as a comparison with similar homes in the area
Home Values in the Area
Average Home Value in this Area
Purchase History
| Date | Buyer | Sale Price | Title Company |
|---|---|---|---|
| Preston John S | -- | Old Republic Title Company | |
| Preston John S | -- | Fidelity National Title Co | |
| Preston John S | $305,000 | Chicago Title Co |
Source: Public Records
Mortgage History
| Date | Status | Borrower | Loan Amount |
|---|---|---|---|
| Open | Preston John S | $195,000 | |
| Closed | Preston John S | $275,000 | |
| Closed | Preston John S | $244,000 |
Source: Public Records
Tax History Compared to Growth
Tax History
| Year | Tax Paid | Tax Assessment Tax Assessment Total Assessment is a certain percentage of the fair market value that is determined by local assessors to be the total taxable value of land and additions on the property. | Land | Improvement |
|---|---|---|---|---|
| 2025 | $10,900 | $499,653 | $151,996 | $354,657 |
| 2024 | $10,900 | $489,718 | $149,015 | $347,703 |
| 2023 | $10,714 | $486,980 | $146,094 | $340,886 |
| 2022 | $10,423 | $470,434 | $143,230 | $334,204 |
| 2021 | $10,021 | $461,074 | $140,422 | $327,652 |
| 2020 | $9,949 | $463,276 | $138,983 | $324,293 |
| 2019 | $9,686 | $454,193 | $136,258 | $317,935 |
| 2018 | $9,381 | $445,290 | $133,587 | $311,703 |
| 2017 | $9,332 | $436,561 | $130,968 | $305,593 |
| 2016 | $8,729 | $428,003 | $128,401 | $299,602 |
| 2015 | $8,680 | $421,576 | $126,473 | $295,103 |
| 2014 | $8,570 | $413,320 | $123,996 | $289,324 |
Source: Public Records
Map
Nearby Homes
- 1059 Ranleigh Way
- 1067 Ranleigh Way
- 1051 Ranleigh Way
- 1070 Winsor Ave
- 1069 Ranleigh Way
- 1064 Winsor Ave
- 1058 Winsor Ave
- 1080 Winsor Ave
- 1094 Ranleigh Way
- 1098 Ranleigh Way
- 1054 Winsor Ave
- 1086 Ranleigh Way
- 1101 Ranleigh Way
- 1090 Winsor Ave
- 1041 Ranleigh Way
- 1100 Ranleigh Way
- 216 Wildwood Ave
- 1050 Winsor Ave
- 1105 Ranleigh Way
- 1045 Harvard Rd