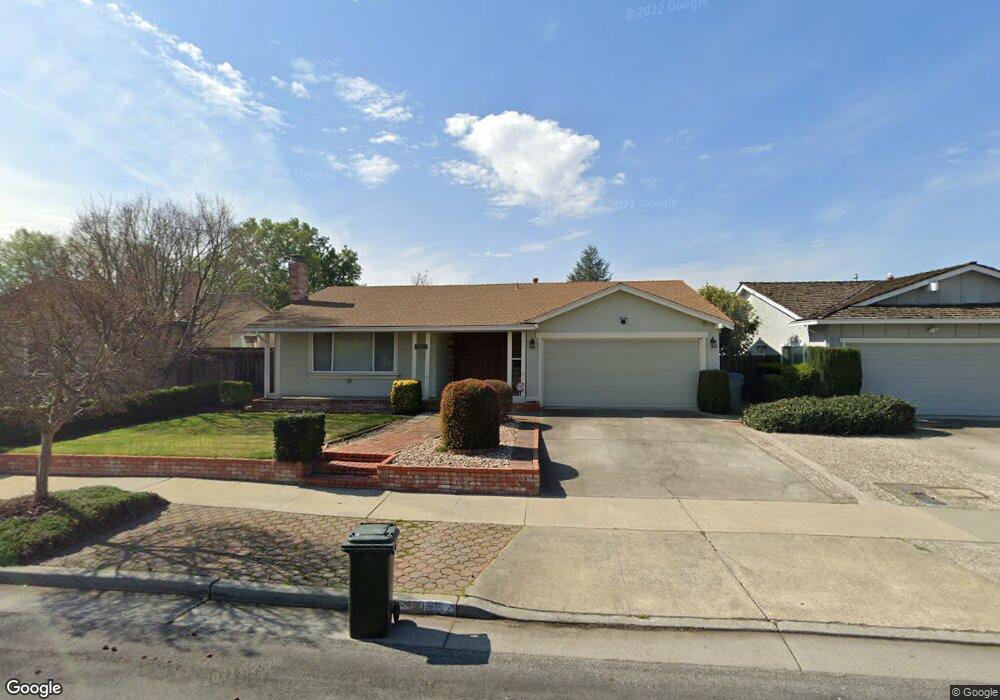
1063 Wilsham Dr San Jose, CA 95132
Penitencia NeighborhoodEstimated Value: $1,510,093 - $1,830,000
4
Beds
2
Baths
1,580
Sq Ft
$1,064/Sq Ft
Est. Value
About This Home
This home is located at 1063 Wilsham Dr, San Jose, CA 95132 and is currently estimated at $1,680,523, approximately $1,063 per square foot. 1063 Wilsham Dr is a home located in Santa Clara County with nearby schools including Summerdale Elementary School, Piedmont Middle School, and Independence High School.
Ownership History
Date
Name
Owned For
Owner Type
Purchase Details
Closed on
Nov 24, 2020
Sold by
Fangonilo Richard and Fangonilo Renee
Bought by
Fangonilo Richard and Fangonilo Renee
Current Estimated Value
Purchase Details
Closed on
Mar 10, 2015
Sold by
Fangonilo Renee and Broussard Rochelle
Bought by
Fangonilo Renee
Purchase Details
Closed on
Jul 12, 2007
Sold by
Bassoni James A
Bought by
Bassoni James A
Create a Home Valuation Report for This Property
The Home Valuation Report is an in-depth analysis detailing your home's value as well as a comparison with similar homes in the area
Home Values in the Area
Average Home Value in this Area
Purchase History
| Date | Buyer | Sale Price | Title Company |
|---|---|---|---|
| Fangonilo Richard | -- | None Available | |
| Fangonilo Renee | -- | None Available | |
| Bassoni James A | -- | None Available |
Source: Public Records
Tax History Compared to Growth
Tax History
| Year | Tax Paid | Tax Assessment Tax Assessment Total Assessment is a certain percentage of the fair market value that is determined by local assessors to be the total taxable value of land and additions on the property. | Land | Improvement |
|---|---|---|---|---|
| 2025 | $4,388 | $219,818 | $80,565 | $139,253 |
| 2024 | $4,388 | $215,509 | $78,986 | $136,523 |
| 2023 | $4,274 | $211,285 | $77,438 | $133,847 |
| 2022 | $4,234 | $207,143 | $75,920 | $131,223 |
| 2021 | $4,062 | $203,082 | $74,432 | $128,650 |
| 2020 | $3,911 | $201,000 | $73,669 | $127,331 |
| 2019 | $3,756 | $197,060 | $72,225 | $124,835 |
| 2018 | $3,687 | $193,197 | $70,809 | $122,388 |
| 2017 | $3,685 | $189,410 | $69,421 | $119,989 |
| 2016 | $3,530 | $185,697 | $68,060 | $117,637 |
| 2015 | $3,006 | $152,013 | $40,151 | $111,862 |
| 2014 | $2,466 | $149,036 | $39,365 | $109,671 |
Source: Public Records
Map
Nearby Homes
- 1055 N Capitol Ave Unit 124
- 1055 N Capitol Ave Unit 180
- 1055 N Capitol Ave Unit 51
- Residence 2 Plan at Ascend
- Residence 1 Plan at Ascend
- Residence 3 Plan at Ascend
- 998 Harcot Ct
- 982 Harcot Ct
- 994 Harcot Ct
- 997 Harcot Ct
- 981 Harcot Ct
- 1062 Rymar Place
- 970 E Harcot Ct
- 985 Harcot Ct
- 990 Harcot Ct
- 2806 Glauser Dr
- 825 N Capitol Ave Unit 4
- 1199 Morrill Ave
- 2520 Amaryl Dr
- 811 Salt Lake Dr
- 1061 Wilsham Dr
- 1065 Wilsham Dr
- 1052 Belford Dr
- 1056 Belford Dr
- 1057 Wilsham Dr
- 1067 Wilsham Dr
- 1060 Belford Dr
- 1048 Belford Dr
- 1062 Wilsham Dr
- 1064 Wilsham Dr
- 1053 Wilsham Dr
- 1071 Wilsham Dr
- 1058 Wilsham Dr
- 1064 Belford Dr
- 1066 Wilsham Dr
- 1054 Wilsham Dr
- 1068 Wilsham Dr
- 1044 Belford Dr
- 1073 Wilsham Dr
- 1041 Wilsham Dr